|
Download Data (XLS File) |
|
||||||||
|
||||||||
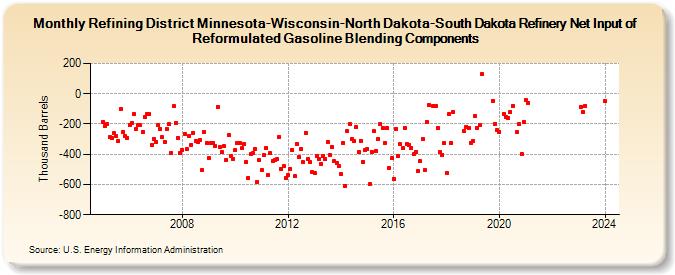
| Refining District Minnesota-Wisconsin-North Dakota-South Dakota Refinery Net Input of Reformulated Gasoline Blending Components (Thousand Barrels) | ||||||||
| Year | Jan | Feb | Mar | Apr | May | Jun | Jul | Aug | Sep | Oct | Nov | Dec |
|---|---|---|---|---|---|---|---|---|---|---|---|---|
| 2005 | -186 | -212 | -199 | -287 | -296 | -262 | -280 | -314 | -102 | -254 | -280 | -292 |
| 2006 | -204 | -191 | -134 | -231 | -208 | -210 | -254 | -156 | -134 | -135 | -339 | -299 |
| 2007 | -321 | -205 | -230 | -288 | -317 | -235 | -203 | -391 | -83 | -192 | -290 | -391 |
| 2008 | -372 | -263 | -367 | -281 | -338 | -258 | -311 | -317 | -305 | -505 | -255 | -327 |
| 2009 | -423 | -326 | -323 | -346 | -86 | -352 | -388 | -348 | -435 | -275 | -410 | -430 |
| 2010 | -373 | -324 | -325 | -361 | -335 | -449 | -555 | -400 | -395 | -365 | -583 | -441 |
| 2011 | -505 | -406 | -356 | -540 | -395 | -446 | -437 | -434 | -283 | -500 | -480 | -555 |
| 2012 | -540 | -495 | -372 | -547 | -332 | -419 | -364 | -454 | -259 | -432 | -454 | -520 |
| 2013 | -526 | -413 | -429 | -462 | -415 | -433 | -317 | -406 | -351 | -447 | -459 | -477 |
| 2014 | -534 | -326 | -607 | -249 | -197 | -298 | -310 | -219 | -386 | -310 | -449 | -373 |
| 2015 | -367 | -600 | -385 | -249 | -379 | -299 | -203 | -224 | -324 | -229 | -489 | -425 |
| 2016 | -561 | -230 | -413 | -334 | -359 | -224 | -331 | -336 | -358 | -401 | -384 | -512 |
| 2017 | -448 | -299 | -503 | -187 | -76 | -80 | -80 | -227 | -388 | -404 | -328 | |
| 2018 | -525 | -136 | -327 | -119 | -247 | -218 | -227 | -324 | ||||
| 2019 | -312 | -150 | -224 | -207 | 129 | -45 | -198 | -242 | ||||
| 2020 | -252 | -134 | -154 | -160 | -120 | -80 | -255 | -201 | -398 | -186 | ||
| 2021 | -40 | -60 | ||||||||||
| 2023 | -85 | -120 | -80 | |||||||||
| 2024 | -50 | |||||||||||
| - = No Data Reported; -- = Not Applicable; NA = Not Available; W = Withheld to avoid disclosure of individual company data. |
| Release Date: 3/29/2024 |
| Next Release Date: 4/30/2024 |