|
Download Data (XLS File) |
|
||||||||
|
||||||||
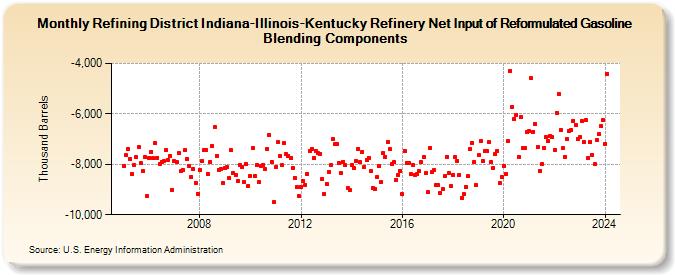
| Refining District Indiana-Illinois-Kentucky Refinery Net Input of Reformulated Gasoline Blending Components (Thousand Barrels) | ||||||||
| Year | Jan | Feb | Mar | Apr | May | Jun | Jul | Aug | Sep | Oct | Nov | Dec |
|---|---|---|---|---|---|---|---|---|---|---|---|---|
| 2005 | -8,048 | -7,647 | -7,403 | -7,792 | -8,388 | -8,036 | -7,719 | -7,308 | -7,955 | -8,282 | -7,714 | -9,273 |
| 2006 | -7,736 | -7,495 | -7,762 | -7,160 | -7,737 | -7,975 | -7,898 | -7,887 | -7,438 | -7,818 | -7,662 | -9,000 |
| 2007 | -7,879 | -7,925 | -7,566 | -8,278 | -8,229 | -7,438 | -7,787 | -8,048 | -8,507 | -8,186 | -8,731 | -9,159 |
| 2008 | -8,215 | -7,864 | -7,449 | -7,425 | -8,386 | -7,905 | -7,264 | -6,538 | -7,658 | -8,212 | -8,172 | -8,741 |
| 2009 | -8,147 | -8,120 | -8,549 | -7,444 | -8,362 | -8,441 | -8,656 | -8,029 | -8,124 | -8,706 | -8,001 | -8,859 |
| 2010 | -8,462 | -7,357 | -8,471 | -8,028 | -8,701 | -8,080 | -8,028 | -8,178 | -7,387 | -6,830 | -7,898 | -9,496 |
| 2011 | -8,102 | -7,131 | -7,671 | -8,047 | -7,168 | -7,597 | -7,662 | -7,755 | -8,145 | -8,531 | -8,885 | -9,242 |
| 2012 | -8,903 | -8,671 | -8,803 | -8,370 | -7,477 | -7,392 | -7,758 | -7,480 | -7,567 | -7,572 | -8,569 | -9,167 |
| 2013 | -8,771 | -8,301 | -8,038 | -7,014 | -7,214 | -7,187 | -7,939 | -8,361 | -7,904 | -8,035 | -8,946 | -9,038 |
| 2014 | -8,030 | -8,158 | -7,864 | -7,389 | -7,927 | -7,501 | -8,108 | -7,815 | -7,738 | -8,271 | -8,933 | -8,981 |
| 2015 | -8,497 | -8,048 | -8,712 | -7,545 | -7,694 | -7,097 | -7,411 | -7,972 | -7,902 | -8,606 | -8,421 | -8,270 |
| 2016 | -9,192 | -7,461 | -7,933 | -7,941 | -8,398 | -8,039 | -8,426 | -8,378 | -8,283 | -7,910 | -7,727 | -8,357 |
| 2017 | -9,109 | -7,343 | -8,313 | -8,234 | -8,831 | -8,823 | -9,136 | -8,973 | -8,473 | -7,700 | -8,364 | -8,880 |
| 2018 | -8,418 | -7,711 | -7,853 | -8,411 | -9,329 | -9,181 | -8,891 | -8,476 | -7,389 | -7,148 | -7,905 | -8,830 |
| 2019 | -7,646 | -7,072 | -7,865 | -7,473 | -7,486 | -7,116 | -7,927 | -8,127 | -7,602 | -7,465 | -8,748 | -8,486 |
| 2020 | -8,065 | -8,384 | -7,086 | -4,288 | -5,724 | -6,184 | -6,025 | -7,708 | -6,131 | -7,350 | -7,354 | -6,735 |
| 2021 | -6,687 | -4,588 | -6,699 | -6,407 | -7,313 | -8,247 | -7,984 | -7,339 | -6,926 | -7,082 | -6,881 | -6,928 |
| 2022 | -7,417 | -5,953 | -5,206 | -6,627 | -7,368 | -7,699 | -7,012 | -6,694 | -6,647 | -6,274 | -6,435 | -7,004 |
| 2023 | -6,918 | -6,276 | -7,125 | -6,246 | -7,758 | -7,107 | -7,633 | -8,007 | -7,040 | -6,812 | -6,471 | -6,225 |
| 2024 | -7,189 | |||||||||||
| - = No Data Reported; -- = Not Applicable; NA = Not Available; W = Withheld to avoid disclosure of individual company data. |
| Release Date: 3/29/2024 |
| Next Release Date: 4/30/2024 |