|
Download Data (XLS File) |
|
||||||||
|
||||||||
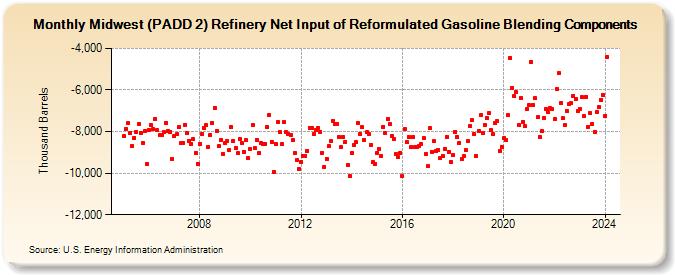
| Midwest (PADD 2) Refinery Net Input of Reformulated Gasoline Blending Components (Thousand Barrels) | ||||||||
| Year | Jan | Feb | Mar | Apr | May | Jun | Jul | Aug | Sep | Oct | Nov | Dec |
|---|---|---|---|---|---|---|---|---|---|---|---|---|
| 2005 | -8,234 | -7,859 | -7,602 | -8,079 | -8,684 | -8,298 | -7,999 | -7,622 | -8,057 | -8,536 | -7,994 | -9,565 |
| 2006 | -7,940 | -7,686 | -7,896 | -7,391 | -7,945 | -8,185 | -8,152 | -8,043 | -7,572 | -7,953 | -8,001 | -9,299 |
| 2007 | -8,200 | -8,130 | -7,796 | -8,566 | -8,546 | -7,673 | -8,090 | -8,439 | -8,590 | -8,378 | -9,021 | -9,550 |
| 2008 | -8,587 | -8,127 | -7,816 | -7,706 | -8,724 | -8,163 | -7,575 | -6,855 | -7,963 | -8,717 | -8,427 | -9,068 |
| 2009 | -8,570 | -8,446 | -8,872 | -7,790 | -8,448 | -8,793 | -9,044 | -8,377 | -8,559 | -8,981 | -8,411 | -9,289 |
| 2010 | -8,835 | -7,681 | -8,796 | -8,389 | -9,036 | -8,529 | -8,583 | -8,578 | -7,782 | -7,195 | -8,481 | -9,937 |
| 2011 | -8,607 | -7,537 | -8,027 | -8,587 | -7,563 | -8,043 | -8,099 | -8,189 | -8,428 | -9,031 | -9,365 | -9,797 |
| 2012 | -9,443 | -9,166 | -9,175 | -8,917 | -7,809 | -7,811 | -8,122 | -7,934 | -7,826 | -8,004 | -9,023 | -9,687 |
| 2013 | -9,297 | -8,714 | -8,467 | -7,476 | -7,629 | -7,620 | -8,256 | -8,767 | -8,255 | -8,482 | -9,603 | -10,133 |
| 2014 | -9,025 | -8,634 | -8,521 | -7,588 | -8,124 | -7,799 | -8,418 | -8,034 | -8,124 | -8,625 | -9,482 | -9,555 |
| 2015 | -9,014 | -8,848 | -9,182 | -7,761 | -8,073 | -7,396 | -7,614 | -8,196 | -8,371 | -9,085 | -9,227 | -9,012 |
| 2016 | -10,150 | -7,881 | -8,500 | -8,275 | -8,757 | -8,263 | -8,757 | -8,764 | -8,691 | -8,604 | -8,312 | -9,068 |
| 2017 | -9,679 | -7,846 | -8,981 | -8,469 | -8,956 | -8,867 | -9,266 | -9,168 | -8,825 | -8,238 | -8,962 | -9,445 |
| 2018 | -9,116 | -8,007 | -8,260 | -8,530 | -9,329 | -9,181 | -8,891 | -8,476 | -7,736 | -7,465 | -8,132 | -9,154 |
| 2019 | -7,958 | -7,222 | -8,089 | -7,680 | -7,357 | -7,116 | -7,927 | -8,127 | -7,602 | -7,510 | -8,946 | -8,728 |
| 2020 | -8,317 | -8,384 | -7,220 | -4,442 | -5,884 | -6,304 | -6,105 | -7,708 | -6,386 | -7,551 | -7,752 | -6,921 |
| 2021 | -6,727 | -4,648 | -6,699 | -6,407 | -7,313 | -8,247 | -7,984 | -7,339 | -6,926 | -7,082 | -6,881 | -6,928 |
| 2022 | -7,417 | -5,953 | -5,206 | -6,627 | -7,368 | -7,699 | -7,012 | -6,694 | -6,647 | -6,274 | -6,435 | -7,004 |
| 2023 | -6,918 | -6,361 | -7,245 | -6,326 | -7,758 | -7,107 | -7,633 | -8,007 | -7,040 | -6,812 | -6,471 | -6,225 |
| 2024 | -7,239 | |||||||||||
| - = No Data Reported; -- = Not Applicable; NA = Not Available; W = Withheld to avoid disclosure of individual company data. |
| Release Date: 3/29/2024 |
| Next Release Date: 4/30/2024 |