|
Download Data (XLS File) |
|
||||||||
|
||||||||
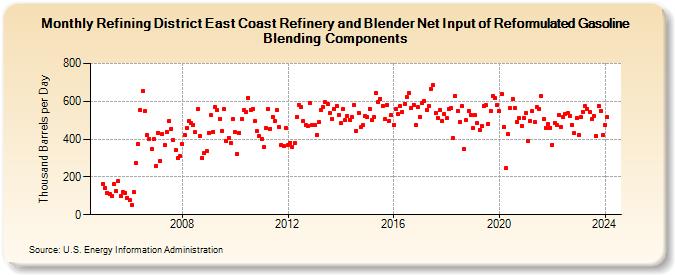
| Refining District East Coast Refinery and Blender Net Input of Reformulated Gasoline Blending Components (Thousand Barrels per Day) | ||||||||
| Year | Jan | Feb | Mar | Apr | May | Jun | Jul | Aug | Sep | Oct | Nov | Dec |
|---|---|---|---|---|---|---|---|---|---|---|---|---|
| 2005 | 164 | 143 | 117 | 111 | 97 | 160 | 123 | 178 | 98 | 119 | 117 | 90 |
| 2006 | 77 | 52 | 120 | 272 | 374 | 554 | 654 | 550 | 420 | 402 | 350 | 400 |
| 2007 | 258 | 434 | 286 | 427 | 367 | 438 | 496 | 455 | 396 | 341 | 299 | 311 |
| 2008 | 374 | 422 | 459 | 495 | 483 | 477 | 436 | 559 | 417 | 301 | 325 | 335 |
| 2009 | 434 | 525 | 437 | 571 | 552 | 508 | 444 | 559 | 388 | 408 | 378 | 505 |
| 2010 | 436 | 322 | 434 | 506 | 553 | 545 | 619 | 555 | 559 | 494 | 441 | 416 |
| 2011 | 398 | 356 | 458 | 558 | 456 | 517 | 497 | 552 | 465 | 370 | 364 | 460 |
| 2012 | 368 | 382 | 360 | 379 | 517 | 582 | 569 | 495 | 475 | 471 | 593 | 474 |
| 2013 | 474 | 424 | 488 | 554 | 570 | 594 | 588 | 539 | 508 | 557 | 577 | 530 |
| 2014 | 483 | 557 | 499 | 523 | 503 | 517 | 581 | 445 | 540 | 462 | 472 | 522 |
| 2015 | 515 | 560 | 501 | 515 | 642 | 596 | 614 | 575 | 504 | 583 | 498 | 525 |
| 2016 | 475 | 560 | 534 | 575 | 545 | 587 | 621 | 644 | 565 | 581 | 473 | 568 |
| 2017 | 519 | 590 | 599 | 554 | 576 | 666 | 684 | 537 | 513 | 556 | 497 | 531 |
| 2018 | 510 | 559 | 564 | 404 | 629 | 550 | 492 | 574 | 348 | 499 | 550 | 530 |
| 2019 | 458 | 526 | 484 | 450 | 468 | 576 | 578 | 480 | 549 | 627 | 615 | 581 |
| 2020 | 547 | 638 | 464 | 246 | 425 | 562 | 613 | 567 | 493 | 509 | 471 | 513 |
| 2021 | 539 | 390 | 495 | 546 | 490 | 568 | 561 | 626 | 504 | 461 | 480 | 461 |
| 2022 | 371 | 487 | 475 | 525 | 466 | 517 | 533 | 538 | 523 | 477 | 430 | 511 |
| 2023 | 424 | 516 | 545 | 573 | 561 | 542 | 504 | 521 | 417 | 576 | 550 | 422 |
| 2024 | 475 | |||||||||||
| - = No Data Reported; -- = Not Applicable; NA = Not Available; W = Withheld to avoid disclosure of individual company data. |
| Release Date: 3/29/2024 |
| Next Release Date: 4/30/2024 |