|
Download Data (XLS File) |
|
||||||||
|
||||||||
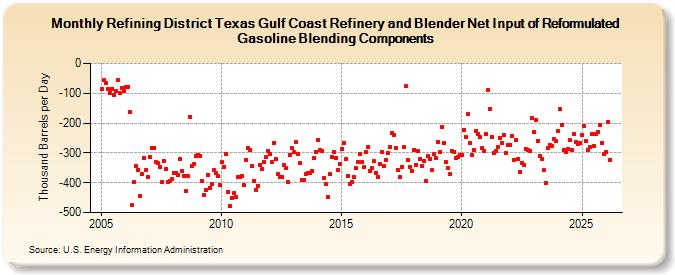
| Refining District Texas Gulf Coast Refinery and Blender Net Input of Reformulated Gasoline Blending Components (Thousand Barrels per Day) | ||||||||
| Year | Jan | Feb | Mar | Apr | May | Jun | Jul | Aug | Sep | Oct | Nov | Dec |
|---|---|---|---|---|---|---|---|---|---|---|---|---|
| 2005 | -84 | -57 | -67 | -87 | -99 | -84 | -107 | -92 | -56 | -100 | -81 | -93 |
| 2006 | -78 | -78 | -164 | -476 | -399 | -345 | -358 | -445 | -371 | -316 | -358 | -381 |
| 2007 | -314 | -285 | -285 | -331 | -335 | -347 | -399 | -326 | -354 | -397 | -395 | -388 |
| 2008 | -367 | -368 | -375 | -321 | -360 | -376 | -428 | -378 | -180 | -344 | -338 | -309 |
| 2009 | -306 | -311 | -394 | -441 | -423 | -374 | -417 | -404 | -357 | -366 | -378 | -409 |
| 2010 | -332 | -347 | -305 | -430 | -477 | -451 | -434 | -449 | -380 | -381 | -379 | -408 |
| 2011 | -325 | -283 | -291 | -343 | -393 | -423 | -410 | -339 | -353 | -332 | -314 | -295 |
| 2012 | -303 | -332 | -266 | -321 | -372 | -380 | -382 | -340 | -349 | -396 | -306 | -283 |
| 2013 | -298 | -262 | -304 | -333 | -392 | -391 | -370 | -366 | -366 | -361 | -317 | -296 |
| 2014 | -255 | -289 | -295 | -383 | -405 | -448 | -372 | -312 | -296 | -317 | -358 | -336 |
| 2015 | -286 | -267 | -321 | -378 | -404 | -397 | -380 | -351 | -330 | -304 | -332 | -347 |
| 2016 | -296 | -281 | -362 | -352 | -327 | -368 | -381 | -336 | -297 | -344 | -323 | -301 |
| 2017 | -279 | -232 | -240 | -283 | -356 | -382 | -347 | -280 | -77 | -324 | -347 | -359 |
| 2018 | -290 | -339 | -295 | -320 | -343 | -327 | -395 | -311 | -321 | -358 | -303 | -317 |
| 2019 | -262 | -298 | -214 | -268 | -332 | -349 | -372 | -294 | -296 | -317 | -312 | -306 |
| 2020 | -308 | -224 | -248 | -171 | -267 | -307 | -290 | -225 | -235 | -247 | -282 | -293 |
| 2021 | -238 | -90 | -151 | -247 | -300 | -295 | -279 | -249 | -268 | -240 | -301 | -273 |
| 2022 | -272 | -242 | -323 | -257 | -320 | -363 | -333 | -339 | -286 | -291 | -292 | -184 |
| 2023 | -233 | -190 | -258 | -311 | -325 | -353 | -401 | -289 | -266 | -279 | -256 | -255 |
| 2024 | -227 | |||||||||||
| - = No Data Reported; -- = Not Applicable; NA = Not Available; W = Withheld to avoid disclosure of individual company data. |
| Release Date: 3/29/2024 |
| Next Release Date: 4/30/2024 |