|
Download Data (XLS File) |
|
||||||||
|
||||||||
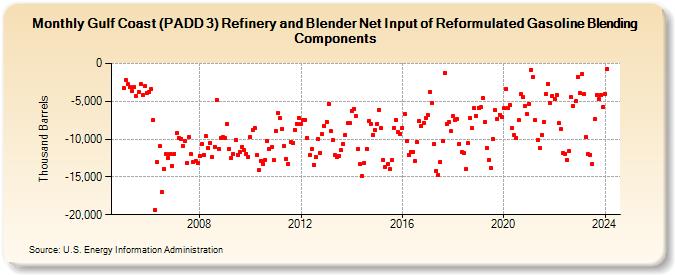
| Gulf Coast (PADD 3) Refinery and Blender Net Input of Reformulated Gasoline Blending Components (Thousand Barrels) | ||||||||
| Year | Jan | Feb | Mar | Apr | May | Jun | Jul | Aug | Sep | Oct | Nov | Dec |
|---|---|---|---|---|---|---|---|---|---|---|---|---|
| 2005 | -3,293 | -2,186 | -2,766 | -3,171 | -3,704 | -3,127 | -4,340 | -3,744 | -2,759 | -4,158 | -3,033 | -3,853 |
| 2006 | -3,798 | -3,405 | -7,506 | -19,357 | -13,086 | -10,915 | -16,964 | -13,900 | -11,988 | -12,476 | -11,928 | -13,517 |
| 2007 | -11,935 | -9,243 | -9,871 | -9,924 | -10,854 | -10,235 | -13,187 | -9,740 | -12,025 | -13,089 | -12,850 | -13,124 |
| 2008 | -12,204 | -10,714 | -12,041 | -9,652 | -11,123 | -10,561 | -12,419 | -11,001 | -4,802 | -11,270 | -9,864 | -9,727 |
| 2009 | -9,832 | -8,032 | -11,261 | -12,478 | -11,949 | -10,122 | -12,065 | -11,732 | -11,038 | -11,488 | -11,924 | -12,347 |
| 2010 | -9,716 | -8,755 | -8,524 | -12,077 | -14,138 | -12,842 | -13,272 | -12,726 | -10,214 | -11,345 | -11,082 | -12,708 |
| 2011 | -8,911 | -6,566 | -7,234 | -8,629 | -10,932 | -12,627 | -13,252 | -10,356 | -10,452 | -8,735 | -7,961 | -7,182 |
| 2012 | -8,028 | -7,515 | -7,422 | -9,827 | -12,108 | -11,314 | -13,382 | -12,376 | -9,965 | -11,780 | -9,337 | -8,252 |
| 2013 | -7,702 | -5,298 | -8,949 | -10,153 | -12,163 | -12,325 | -12,205 | -11,495 | -10,648 | -9,456 | -7,906 | -7,926 |
| 2014 | -6,239 | -5,980 | -6,973 | -11,327 | -13,345 | -14,916 | -13,119 | -11,333 | -7,599 | -8,008 | -9,441 | -8,775 |
| 2015 | -7,939 | -6,167 | -8,551 | -12,739 | -13,732 | -13,331 | -13,994 | -12,828 | -8,477 | -7,443 | -9,120 | -9,282 |
| 2016 | -8,547 | -6,684 | -10,297 | -12,049 | -11,712 | -11,652 | -12,889 | -10,445 | -7,601 | -8,218 | -7,808 | -7,231 |
| 2017 | -6,834 | -3,765 | -5,206 | -10,711 | -14,177 | -14,771 | -12,992 | -10,297 | -1,211 | -8,027 | -7,724 | -8,991 |
| 2018 | -6,968 | -7,439 | -7,343 | -10,602 | -11,750 | -11,858 | -13,932 | -10,568 | -7,236 | -8,585 | -5,936 | -6,936 |
| 2019 | -5,830 | -5,813 | -4,577 | -7,702 | -11,163 | -12,735 | -13,757 | -9,999 | -6,135 | -7,311 | -6,764 | -7,102 |
| 2020 | -5,934 | -3,364 | -5,858 | -5,473 | -8,475 | -9,500 | -9,817 | -7,529 | -4,069 | -4,493 | -5,649 | -6,631 |
| 2021 | -5,295 | -811 | -1,792 | -7,497 | -10,061 | -11,197 | -9,458 | -7,696 | -4,005 | -2,656 | -5,185 | -4,255 |
| 2022 | -4,697 | -4,111 | -7,908 | -8,688 | -11,860 | -11,937 | -12,724 | -11,585 | -4,492 | -5,607 | -5,013 | -1,741 |
| 2023 | -3,938 | -1,359 | -4,079 | -9,717 | -12,020 | -12,099 | -13,321 | -7,376 | -4,182 | -4,743 | -4,153 | -5,700 |
| 2024 | -4,012 | |||||||||||
| - = No Data Reported; -- = Not Applicable; NA = Not Available; W = Withheld to avoid disclosure of individual company data. |
| Release Date: 3/29/2024 |
| Next Release Date: 4/30/2024 |