|
Download Data (XLS File) |
|
||||||||
|
||||||||
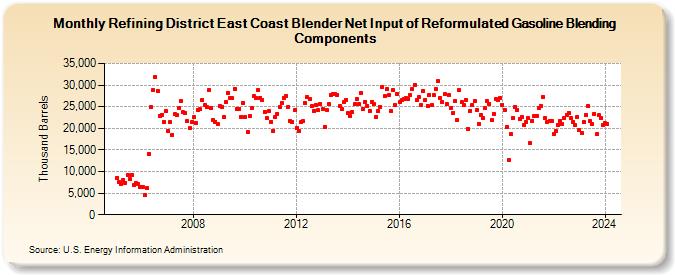
| Refining District East Coast Blender Net Input of Reformulated Gasoline Blending Components (Thousand Barrels) | ||||||||
| Year | Jan | Feb | Mar | Apr | May | Jun | Jul | Aug | Sep | Oct | Nov | Dec |
|---|---|---|---|---|---|---|---|---|---|---|---|---|
| 2005 | 8,560 | 7,484 | 7,069 | 8,118 | 7,406 | 9,158 | 8,237 | 9,284 | 6,767 | 7,319 | 7,202 | 6,528 |
| 2006 | 6,369 | 4,541 | 6,137 | 14,163 | 24,822 | 28,823 | 31,824 | 28,583 | 22,889 | 23,161 | 21,422 | 23,977 |
| 2007 | 19,367 | 21,383 | 18,563 | 23,219 | 23,005 | 24,773 | 26,287 | 23,691 | 23,495 | 21,613 | 19,978 | 21,401 |
| 2008 | 22,504 | 21,264 | 24,177 | 24,402 | 26,595 | 25,393 | 24,884 | 28,831 | 24,793 | 22,016 | 21,570 | 21,007 |
| 2009 | 25,203 | 24,950 | 22,669 | 26,156 | 28,277 | 26,919 | 26,975 | 29,190 | 24,534 | 24,551 | 22,709 | 25,860 |
| 2010 | 22,669 | 19,238 | 22,806 | 24,716 | 27,402 | 26,923 | 28,863 | 27,107 | 26,540 | 23,839 | 22,299 | 23,981 |
| 2011 | 21,535 | 19,468 | 22,662 | 23,378 | 24,830 | 25,870 | 27,052 | 27,584 | 24,995 | 21,688 | 21,429 | 24,166 |
| 2012 | 20,102 | 19,365 | 21,424 | 21,582 | 25,750 | 27,170 | 26,853 | 25,098 | 24,021 | 25,409 | 24,172 | 25,691 |
| 2013 | 24,496 | 20,408 | 24,297 | 25,591 | 27,595 | 27,835 | 27,913 | 27,773 | 25,113 | 24,497 | 26,067 | 26,618 |
| 2014 | 23,507 | 22,805 | 23,813 | 25,508 | 26,789 | 25,618 | 28,062 | 24,450 | 26,193 | 25,163 | 24,089 | 26,087 |
| 2015 | 25,553 | 22,703 | 24,047 | 25,016 | 29,671 | 27,423 | 29,009 | 27,639 | 23,945 | 28,806 | 25,354 | 27,953 |
| 2016 | 25,974 | 26,468 | 26,732 | 26,987 | 26,883 | 27,665 | 29,114 | 30,111 | 26,596 | 27,251 | 25,462 | 28,709 |
| 2017 | 26,558 | 25,227 | 27,715 | 25,328 | 27,617 | 29,121 | 30,873 | 27,061 | 26,183 | 27,837 | 25,680 | 27,604 |
| 2018 | 24,807 | 23,518 | 26,202 | 21,888 | 28,796 | 26,116 | 25,355 | 26,580 | 19,900 | 24,024 | 25,453 | 26,350 |
| 2019 | 24,127 | 21,101 | 23,034 | 22,299 | 24,678 | 26,240 | 25,737 | 21,881 | 23,388 | 26,817 | 26,585 | 27,096 |
| 2020 | 25,408 | 24,252 | 20,266 | 12,725 | 18,638 | 22,408 | 25,019 | 24,334 | 22,137 | 22,528 | 20,867 | 21,497 |
| 2021 | 22,355 | 16,555 | 21,752 | 22,789 | 22,939 | 24,664 | 25,091 | 27,344 | 22,356 | 21,562 | 21,638 | 21,771 |
| 2022 | 18,627 | 19,320 | 20,860 | 21,748 | 21,024 | 22,404 | 23,098 | 23,646 | 22,344 | 21,556 | 20,673 | 22,713 |
| 2023 | 19,590 | 18,969 | 21,475 | 23,077 | 25,211 | 21,595 | 20,906 | 23,325 | 18,605 | 23,027 | 22,279 | 20,661 |
| 2024 | 21,158 | |||||||||||
| - = No Data Reported; -- = Not Applicable; NA = Not Available; W = Withheld to avoid disclosure of individual company data. |
| Release Date: 3/29/2024 |
| Next Release Date: 4/30/2024 |