|
Download Data (XLS File) |
|
||||||||
|
||||||||
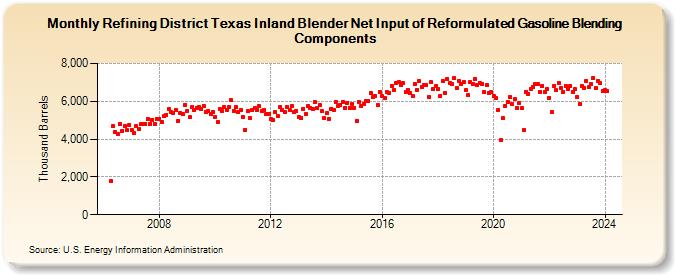
| Refining District Texas Inland Blender Net Input of Reformulated Gasoline Blending Components (Thousand Barrels) | ||||||||
| Year | Jan | Feb | Mar | Apr | May | Jun | Jul | Aug | Sep | Oct | Nov | Dec |
|---|---|---|---|---|---|---|---|---|---|---|---|---|
| 2006 | 1,786 | 4,680 | 4,366 | 4,286 | 4,814 | 4,440 | 4,674 | 4,467 | 4,739 | |||
| 2007 | 4,476 | 4,335 | 4,667 | 4,521 | 4,775 | 4,800 | 4,793 | 5,066 | 4,811 | 5,015 | 4,813 | 5,071 |
| 2008 | 5,087 | 4,897 | 5,205 | 5,300 | 5,569 | 5,415 | 5,399 | 5,559 | 4,974 | 5,404 | 5,348 | 5,816 |
| 2009 | 5,492 | 5,148 | 5,683 | 5,525 | 5,670 | 5,708 | 5,590 | 5,751 | 5,444 | 5,466 | 5,318 | 5,444 |
| 2010 | 5,182 | 4,895 | 5,593 | 5,483 | 5,676 | 5,560 | 5,705 | 6,043 | 5,493 | 5,674 | 5,426 | 5,533 |
| 2011 | 5,183 | 4,497 | 5,472 | 5,126 | 5,519 | 5,624 | 5,545 | 5,731 | 5,478 | 5,554 | 5,310 | 5,348 |
| 2012 | 5,065 | 5,011 | 5,409 | 5,198 | 5,713 | 5,552 | 5,422 | 5,677 | 5,549 | 5,733 | 5,430 | 5,492 |
| 2013 | 5,181 | 5,112 | 5,618 | 5,323 | 5,741 | 5,669 | 5,605 | 5,957 | 5,633 | 5,795 | 5,483 | 5,092 |
| 2014 | 5,375 | 5,064 | 5,610 | 5,543 | 5,988 | 5,762 | 5,806 | 5,978 | 5,671 | 5,923 | 5,660 | 5,834 |
| 2015 | 5,658 | 4,971 | 5,975 | 5,744 | 5,872 | 6,008 | 6,010 | 6,434 | 6,218 | 6,276 | 5,808 | 6,500 |
| 2016 | 6,257 | 6,153 | 6,497 | 6,414 | 6,822 | 6,600 | 6,984 | 7,013 | 6,848 | 6,945 | 6,504 | 6,615 |
| 2017 | 6,440 | 6,255 | 6,905 | 6,614 | 7,051 | 6,775 | 6,866 | 6,873 | 6,232 | 6,996 | 6,658 | 6,785 |
| 2018 | 6,666 | 6,284 | 7,076 | 6,461 | 7,201 | 6,947 | 6,900 | 7,218 | 6,727 | 7,093 | 6,940 | 7,020 |
| 2019 | 6,574 | 6,332 | 6,994 | 6,905 | 7,200 | 6,842 | 6,988 | 6,925 | 6,468 | 6,855 | 6,456 | 6,478 |
| 2020 | 6,296 | 6,171 | 5,546 | 3,927 | 5,092 | 5,768 | 5,943 | 6,215 | 5,878 | 6,107 | 5,663 | 5,935 |
| 2021 | 5,641 | 4,472 | 6,517 | 6,399 | 6,664 | 6,757 | 6,890 | 6,900 | 6,511 | 6,817 | 6,502 | 6,656 |
| 2022 | 6,179 | 5,419 | 6,814 | 6,582 | 6,969 | 6,692 | 6,496 | 6,801 | 6,637 | 6,811 | 6,504 | 6,631 |
| 2023 | 6,229 | 5,866 | 6,835 | 6,713 | 7,086 | 6,740 | 6,900 | 7,245 | 6,681 | 7,078 | 6,944 | 6,563 |
| 2024 | 6,590 | |||||||||||
| - = No Data Reported; -- = Not Applicable; NA = Not Available; W = Withheld to avoid disclosure of individual company data. |
| Release Date: 3/29/2024 |
| Next Release Date: 4/30/2024 |