|
Download Data (XLS File) |
|
||||||||
|
||||||||
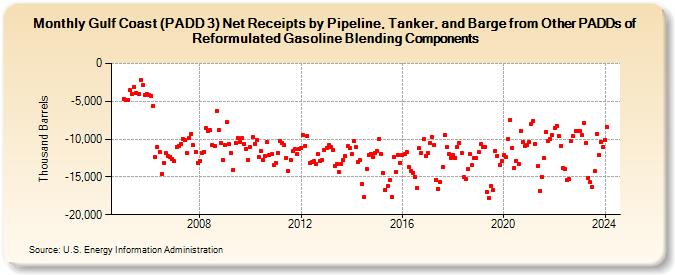
| Gulf Coast (PADD 3) Net Receipts by Pipeline, Tanker, and Barge from Other PADDs of Reformulated Gasoline Blending Components (Thousand Barrels) | ||||||||
| Year | Jan | Feb | Mar | Apr | May | Jun | Jul | Aug | Sep | Oct | Nov | Dec |
|---|---|---|---|---|---|---|---|---|---|---|---|---|
| 2005 | -4,691 | -4,794 | -4,801 | -3,557 | -3,991 | -3,064 | -3,864 | -4,041 | -2,215 | -2,817 | -4,136 | -4,062 |
| 2006 | -4,154 | -4,297 | -5,621 | -12,397 | -11,053 | -11,648 | -14,590 | -13,125 | -11,893 | -12,193 | -12,329 | -12,637 |
| 2007 | -12,957 | -11,021 | -10,961 | -10,687 | -9,926 | -10,180 | -11,841 | -9,844 | -9,298 | -10,816 | -11,659 | -13,113 |
| 2008 | -12,914 | -11,870 | -11,643 | -8,571 | -8,986 | -8,842 | -10,795 | -10,868 | -6,272 | -8,835 | -10,546 | -12,729 |
| 2009 | -10,834 | -7,787 | -10,676 | -11,855 | -14,077 | -10,528 | -9,859 | -10,343 | -9,828 | -10,647 | -11,288 | -12,739 |
| 2010 | -11,059 | -9,746 | -10,664 | -10,110 | -12,316 | -11,535 | -12,733 | -12,285 | -10,444 | -12,056 | -11,993 | -13,490 |
| 2011 | -13,227 | -11,802 | -10,272 | -10,451 | -10,759 | -12,468 | -14,229 | -12,829 | -11,613 | -11,356 | -11,997 | -11,339 |
| 2012 | -11,173 | -9,437 | -10,900 | -9,540 | -13,163 | -13,075 | -12,930 | -13,322 | -11,980 | -12,855 | -12,758 | -11,452 |
| 2013 | -11,140 | -10,814 | -11,097 | -11,389 | -13,520 | -13,336 | -14,336 | -13,266 | -12,764 | -12,288 | -10,914 | -11,223 |
| 2014 | -11,971 | -10,277 | -11,059 | -13,052 | -12,821 | -15,994 | -17,658 | -13,936 | -12,056 | -11,911 | -12,353 | -11,803 |
| 2015 | -11,542 | -9,948 | -11,905 | -14,538 | -16,701 | -16,153 | -15,447 | -17,635 | -12,417 | -14,347 | -12,156 | -13,108 |
| 2016 | -12,103 | -11,984 | -11,742 | -13,723 | -14,237 | -14,432 | -14,961 | -16,466 | -11,223 | -11,839 | -9,999 | -12,251 |
| 2017 | -11,831 | -10,493 | -9,714 | -10,733 | -15,348 | -16,566 | -15,670 | -13,737 | -9,466 | -11,077 | -12,035 | -12,521 |
| 2018 | -12,111 | -12,464 | -11,013 | -10,485 | -11,873 | -15,072 | -15,270 | -13,954 | -12,028 | -13,371 | -12,494 | -12,506 |
| 2019 | -11,767 | -10,691 | -11,106 | -11,012 | -16,940 | -17,751 | -16,172 | -16,750 | -11,535 | -12,201 | -13,454 | -12,908 |
| 2020 | -12,151 | -12,329 | -9,952 | -7,441 | -11,138 | -13,804 | -12,854 | -13,320 | -8,867 | -10,433 | -10,938 | -10,845 |
| 2021 | -10,376 | -8,026 | -7,589 | -10,665 | -13,542 | -16,798 | -14,970 | -12,540 | -9,048 | -10,186 | -9,959 | -9,522 |
| 2022 | -8,592 | -8,202 | -9,545 | -10,847 | -13,835 | -13,991 | -15,412 | -15,250 | -10,272 | -9,585 | -8,911 | -8,961 |
| 2023 | -8,974 | -9,488 | -7,869 | -10,453 | -15,109 | -15,718 | -16,397 | -14,257 | -9,293 | -12,106 | -10,401 | -11,037 |
| 2024 | -10,179 | |||||||||||
| - = No Data Reported; -- = Not Applicable; NA = Not Available; W = Withheld to avoid disclosure of individual company data. |
| Release Date: 3/29/2024 |
| Next Release Date: 4/30/2024 |