|
Download Data (XLS File) |
|
||||||||
|
||||||||
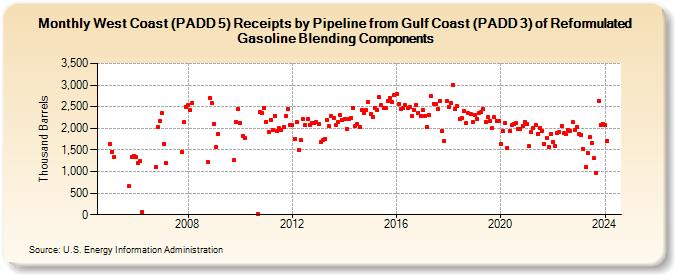
| West Coast (PADD 5) Receipts by Pipeline from Gulf Coast (PADD 3) of Reformulated Gasoline Blending Components (Thousand Barrels) | ||||||||
| Year | Jan | Feb | Mar | Apr | May | Jun | Jul | Aug | Sep | Oct | Nov | Dec |
|---|---|---|---|---|---|---|---|---|---|---|---|---|
| 2005 | 1,632 | 1,460 | 1,330 | 654 | 1,341 | 1,368 | ||||||
| 2006 | 1,344 | 1,195 | 1,237 | 58 | 1,105 | 2,035 | 2,167 | |||||
| 2007 | 2,353 | 1,642 | 1,195 | 1,457 | 2,139 | 2,494 | ||||||
| 2008 | 2,535 | 2,423 | 2,582 | 1,222 | 2,690 | 2,576 | ||||||
| 2009 | 2,106 | 1,570 | 1,864 | 1,260 | 2,153 | 2,452 | ||||||
| 2010 | 2,122 | 1,823 | 1,783 | 10 | 2,377 | 2,358 | 2,475 | |||||
| 2011 | 2,150 | 1,909 | 2,200 | 1,970 | 2,294 | 1,926 | 1,998 | 1,954 | 2,027 | 2,295 | 2,457 | 2,074 |
| 2012 | 2,068 | 1,762 | 2,141 | 1,497 | 1,719 | 2,215 | 2,078 | 2,205 | 2,085 | 2,118 | 2,130 | 2,148 |
| 2013 | 2,105 | 1,680 | 1,721 | 1,762 | 2,195 | 2,051 | 2,277 | 2,248 | 2,072 | 2,143 | 2,313 | 2,193 |
| 2014 | 2,214 | 1,983 | 2,206 | 2,245 | 2,475 | 2,057 | 2,105 | 2,027 | 2,427 | 2,361 | 2,420 | 2,598 |
| 2015 | 2,320 | 2,254 | 2,470 | 2,412 | 2,713 | 2,531 | 2,473 | 2,477 | 2,637 | 2,703 | 2,604 | 2,775 |
| 2016 | 2,798 | 2,570 | 2,442 | 2,461 | 2,540 | 2,479 | 2,491 | 2,287 | 2,432 | 2,545 | 2,351 | 2,281 |
| 2017 | 2,429 | 2,296 | 2,025 | 2,319 | 2,747 | 2,567 | 2,571 | 2,439 | 2,626 | 1,932 | 1,714 | 2,630 |
| 2018 | 2,495 | 2,584 | 3,009 | 2,457 | 2,508 | 2,216 | 2,231 | 2,394 | 2,128 | 2,346 | 2,322 | 2,135 |
| 2019 | 2,299 | 2,210 | 2,351 | 2,377 | 2,446 | 2,155 | 2,260 | 2,178 | 2,001 | 2,254 | 2,170 | 2,179 |
| 2020 | 1,633 | 1,933 | 2,122 | 1,544 | 1,936 | 2,069 | 2,095 | 2,111 | 1,991 | 1,987 | 2,057 | 2,152 |
| 2021 | 2,088 | 1,586 | 1,911 | 2,011 | 2,083 | 1,876 | 2,005 | 1,938 | 1,629 | 1,778 | 1,572 | 1,866 |
| 2022 | 1,689 | 1,593 | 1,899 | 1,913 | 2,051 | 1,888 | 1,869 | 1,954 | 1,940 | 2,144 | 1,971 | 2,031 |
| 2023 | 1,876 | 1,845 | 1,521 | 1,109 | 1,432 | 1,789 | 1,669 | 1,306 | 976 | 2,632 | 2,082 | 2,098 |
| 2024 | 2,086 | |||||||||||
| - = No Data Reported; -- = Not Applicable; NA = Not Available; W = Withheld to avoid disclosure of individual company data. |
| Release Date: 3/29/2024 |
| Next Release Date: 4/30/2024 |