|
Download Data (XLS File) |
|
||||||||
|
||||||||
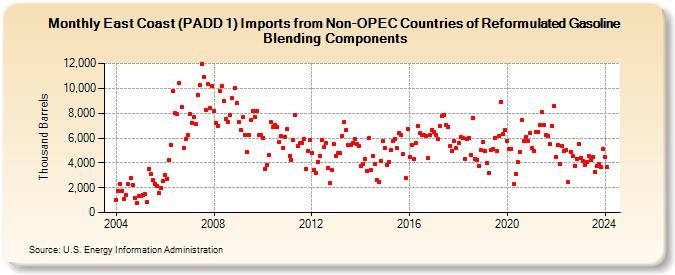
| East Coast (PADD 1) Imports from Non-OPEC Countries of Reformulated Gasoline Blending Components (Thousand Barrels) | ||||||||
| Year | Jan | Feb | Mar | Apr | May | Jun | Jul | Aug | Sep | Oct | Nov | Dec |
|---|---|---|---|---|---|---|---|---|---|---|---|---|
| 2004 | 1,014 | 1,768 | 2,268 | 1,763 | 1,067 | 1,404 | 2,265 | 2,765 | 2,248 | 1,202 | 775 | 1,322 |
| 2005 | 1,362 | 1,440 | 1,467 | 833 | 3,481 | 3,093 | 2,594 | 2,319 | 2,164 | 1,535 | 1,972 | 2,520 |
| 2006 | 2,999 | 2,737 | 4,224 | 5,478 | 9,778 | 7,993 | 7,921 | 10,443 | 8,534 | 5,216 | 5,910 | 6,226 |
| 2007 | 7,953 | 7,236 | 7,660 | 7,155 | 9,423 | 10,272 | 11,920 | 10,877 | 8,278 | 10,310 | 8,415 | 10,195 |
| 2008 | 8,166 | 7,169 | 7,003 | 9,792 | 10,189 | 8,950 | 7,540 | 7,307 | 7,846 | 9,184 | 9,989 | 8,797 |
| 2009 | 7,261 | 6,607 | 7,659 | 6,262 | 4,868 | 6,275 | 7,426 | 8,166 | 7,721 | 8,142 | 6,271 | 6,204 |
| 2010 | 5,984 | 3,475 | 3,868 | 4,613 | 7,273 | 6,865 | 7,051 | 6,874 | 5,692 | 6,161 | 5,212 | 6,116 |
| 2011 | 6,733 | 4,550 | 4,228 | 5,854 | 7,871 | 5,319 | 5,561 | 5,587 | 5,906 | 3,506 | 4,947 | 5,808 |
| 2012 | 4,761 | 3,450 | 3,208 | 4,109 | 4,579 | 5,826 | 5,243 | 5,580 | 3,624 | 2,397 | 3,399 | 5,504 |
| 2013 | 4,530 | 4,800 | 4,826 | 6,172 | 7,300 | 6,668 | 5,450 | 5,456 | 5,639 | 5,960 | 5,543 | 5,374 |
| 2014 | 3,775 | 3,944 | 4,282 | 3,358 | 5,963 | 3,401 | 4,560 | 3,926 | 2,598 | 2,448 | 4,158 | 5,721 |
| 2015 | 5,178 | 3,842 | 4,106 | 5,061 | 5,746 | 5,882 | 5,196 | 6,383 | 6,260 | 4,699 | 2,773 | 6,764 |
| 2016 | 4,476 | 5,456 | 4,324 | 5,559 | 6,998 | 6,371 | 6,203 | 6,270 | 6,138 | 4,410 | 6,229 | 6,681 |
| 2017 | 6,481 | 6,232 | 5,882 | 6,955 | 7,807 | 7,833 | 7,013 | 6,913 | 5,362 | 4,978 | 5,721 | 5,183 |
| 2018 | 5,598 | 6,048 | 5,995 | 4,326 | 5,930 | 6,008 | 4,645 | 7,651 | 4,339 | 4,270 | 3,750 | 5,024 |
| 2019 | 5,658 | 4,927 | 3,953 | 3,196 | 5,050 | 5,087 | 6,009 | 4,964 | 6,202 | 8,905 | 6,290 | 6,617 |
| 2020 | 5,740 | 5,145 | 5,151 | 2,337 | 3,084 | 4,031 | 4,886 | 7,486 | 5,775 | 6,077 | 5,746 | 6,372 |
| 2021 | 5,174 | 4,992 | 6,517 | 6,516 | 7,033 | 8,063 | 7,051 | 6,228 | 6,170 | 5,511 | 6,975 | 8,599 |
| 2022 | 4,490 | 5,428 | 3,905 | 5,374 | 4,973 | 5,064 | 2,439 | 4,901 | 4,516 | 3,745 | 4,341 | 5,553 |
| 2023 | 4,432 | 4,185 | 3,829 | 4,067 | 4,526 | 4,230 | 4,468 | 3,294 | 3,756 | 3,907 | 3,634 | 5,082 |
| 2024 | 4,460 | |||||||||||
| - = No Data Reported; -- = Not Applicable; NA = Not Available; W = Withheld to avoid disclosure of individual company data. |
| Release Date: 3/29/2024 |
| Next Release Date: 4/30/2024 |