|
Download Data (XLS File) |
|
||||||||
|
||||||||
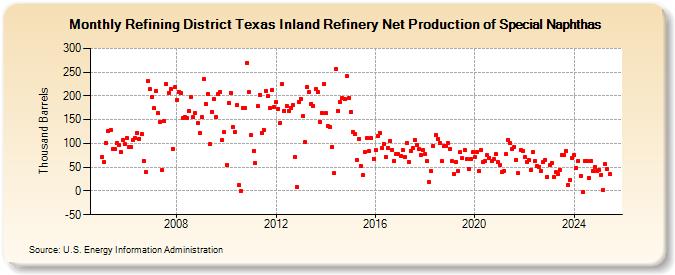
| Refining District Texas Inland Refinery Net Production of Special Naphthas (Thousand Barrels) | ||||||||
| Year | Jan | Feb | Mar | Apr | May | Jun | Jul | Aug | Sep | Oct | Nov | Dec |
|---|---|---|---|---|---|---|---|---|---|---|---|---|
| 2005 | 71 | 61 | 101 | 127 | 129 | 88 | 88 | 101 | 96 | 81 | 107 | 98 |
| 2006 | 111 | 92 | 93 | 107 | 111 | 123 | 110 | 120 | 64 | 39 | 231 | 214 |
| 2007 | 198 | 174 | 210 | 164 | 146 | 44 | 147 | 225 | 207 | 215 | 89 | 218 |
| 2008 | 191 | 209 | 206 | 154 | 156 | 153 | 169 | 198 | 155 | 163 | 142 | 121 |
| 2009 | 155 | 235 | 184 | 204 | 98 | 167 | 194 | 156 | 205 | 209 | 107 | 124 |
| 2010 | 55 | 186 | 207 | 135 | 125 | 180 | 12 | -1 | 175 | 175 | 270 | 208 |
| 2011 | 117 | 85 | 59 | 179 | 202 | 123 | 129 | 211 | 200 | 175 | 212 | 177 |
| 2012 | 187 | 173 | 144 | 225 | 169 | 179 | 169 | 175 | 181 | 71 | 8 | 188 |
| 2013 | 193 | 157 | 103 | 218 | 209 | 184 | 179 | 215 | 208 | 146 | 165 | 226 |
| 2014 | 163 | 136 | 135 | 93 | 37 | 256 | 169 | 188 | 196 | 193 | 241 | 196 |
| 2015 | 167 | 125 | 120 | 66 | 110 | 52 | 33 | 82 | 112 | 84 | 111 | 68 |
| 2016 | 87 | 115 | 123 | 90 | 99 | 71 | 91 | 105 | 87 | 64 | 77 | 77 |
| 2017 | 73 | 87 | 71 | 101 | 61 | 85 | 91 | 108 | 97 | 89 | 76 | 86 |
| 2018 | 77 | 62 | 18 | 41 | 95 | 118 | 110 | 101 | 62 | 94 | 94 | 100 |
| 2019 | 88 | 62 | 36 | 61 | 43 | 81 | 69 | 87 | 67 | 47 | 67 | 81 |
| 2020 | 72 | 81 | 41 | 86 | 61 | 63 | 75 | 70 | 62 | 67 | 77 | 60 |
| 2021 | 55 | 40 | 42 | 77 | 107 | 100 | 88 | 93 | 66 | 37 | 87 | 84 |
| 2022 | 72 | 61 | 65 | 44 | 81 | 63 | 53 | 50 | 42 | 60 | 66 | 30 |
| 2023 | 54 | 59 | 29 | 39 | 36 | 45 | 76 | 76 | 85 | 13 | 23 | 70 |
| 2024 | 76 | |||||||||||
| - = No Data Reported; -- = Not Applicable; NA = Not Available; W = Withheld to avoid disclosure of individual company data. |
| Release Date: 3/29/2024 |
| Next Release Date: 4/30/2024 |