|
Download Data (XLS File) |
|
||||||||
|
||||||||
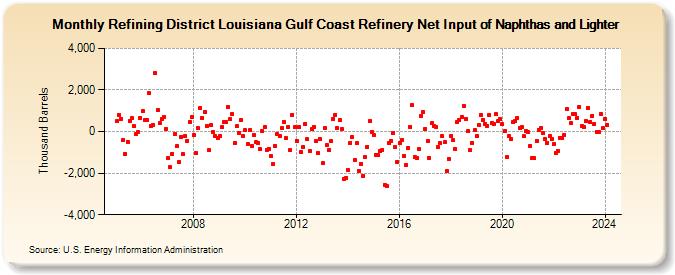
| Refining District Louisiana Gulf Coast Refinery Net Input of Naphthas and Lighter (Thousand Barrels) | ||||||||
| Year | Jan | Feb | Mar | Apr | May | Jun | Jul | Aug | Sep | Oct | Nov | Dec |
|---|---|---|---|---|---|---|---|---|---|---|---|---|
| 2005 | 489 | 800 | 609 | -395 | -1,063 | -482 | 520 | 629 | 245 | -129 | -29 | 670 |
| 2006 | 970 | 561 | 567 | 1,834 | 259 | 339 | 2,802 | 1,032 | 417 | 615 | 688 | 113 |
| 2007 | -1,290 | -1,726 | -1,065 | -128 | -713 | -1,477 | -250 | -1,098 | -223 | -431 | 473 | 695 |
| 2008 | -170 | -1,039 | 156 | 1,141 | 662 | 962 | 278 | -903 | 297 | -44 | -221 | -309 |
| 2009 | -196 | 212 | 451 | 459 | 1,195 | 591 | 834 | -530 | 245 | -54 | 564 | -208 |
| 2010 | 60 | -597 | 62 | -682 | -176 | -522 | -533 | -843 | 14 | 215 | -890 | -836 |
| 2011 | -1,190 | -1,562 | -703 | -130 | -190 | 151 | 481 | -332 | 211 | -907 | 814 | 219 |
| 2012 | -441 | 224 | -986 | -754 | 365 | -378 | -934 | 111 | 233 | -471 | -1,028 | -358 |
| 2013 | -1,532 | 164 | -670 | -884 | -473 | 593 | 815 | 150 | 533 | 124 | -2,264 | -2,220 |
| 2014 | -1,872 | -530 | -270 | -1,357 | -569 | -1,880 | -1,558 | -2,114 | -1,238 | -723 | 502 | -2 |
| 2015 | -180 | -1,104 | -1,141 | -951 | -877 | -2,554 | -2,632 | -540 | -433 | -63 | -760 | -1,461 |
| 2016 | -556 | -406 | -1,197 | -1,611 | -782 | 241 | 1,258 | -1,236 | -1,256 | -840 | 761 | 947 |
| 2017 | 139 | -454 | -1,261 | 404 | 265 | 231 | -733 | -574 | -227 | -520 | -1,917 | -1,299 |
| 2018 | -203 | -410 | -849 | 442 | 534 | 699 | 1,252 | 625 | 14 | -890 | -559 | 70 |
| 2019 | -203 | 293 | 793 | 560 | 379 | 288 | 796 | 409 | 385 | 829 | 503 | 607 |
| 2020 | 348 | 16 | -1,229 | -232 | -374 | 441 | 517 | 655 | 179 | 198 | -232 | 14 |
| 2021 | -37 | -673 | -1,272 | -1,286 | -431 | 84 | 158 | -82 | -364 | -549 | -215 | -361 |
| 2022 | -575 | -1,010 | -915 | -308 | -295 | -161 | 1,061 | 636 | 396 | 839 | 832 | 673 |
| 2023 | 1,196 | 273 | 230 | 502 | 1,125 | 464 | 765 | 374 | -28 | 1 | 858 | 152 |
| 2024 | 615 | |||||||||||
| - = No Data Reported; -- = Not Applicable; NA = Not Available; W = Withheld to avoid disclosure of individual company data. |
| Release Date: 3/29/2024 |
| Next Release Date: 4/30/2024 |