|
Download Data (XLS File) |
|
||||||||
|
||||||||
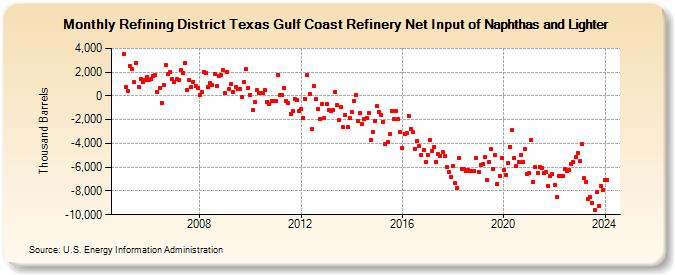
| Refining District Texas Gulf Coast Refinery Net Input of Naphthas and Lighter (Thousand Barrels) | ||||||||
| Year | Jan | Feb | Mar | Apr | May | Jun | Jul | Aug | Sep | Oct | Nov | Dec |
|---|---|---|---|---|---|---|---|---|---|---|---|---|
| 2005 | 3,503 | 718 | 410 | 2,535 | 2,263 | 1,151 | 2,793 | 788 | 1,453 | 1,200 | 1,369 | 1,569 |
| 2006 | 1,364 | 1,427 | 1,682 | 1,733 | 351 | 707 | -559 | 899 | 2,639 | 1,845 | 2,007 | 1,456 |
| 2007 | 1,160 | 1,391 | 1,336 | 2,152 | 1,912 | 2,782 | 509 | 1,353 | 732 | 1,203 | 871 | 674 |
| 2008 | 114 | 334 | 2,034 | 1,909 | 711 | 1,071 | 882 | 1,841 | 864 | 1,701 | 1,790 | 2,168 |
| 2009 | 283 | 2,049 | 599 | 982 | 361 | 724 | 553 | 609 | -130 | 1,154 | 2,234 | 670 |
| 2010 | 101 | -1,224 | -516 | 473 | 253 | 284 | 227 | 465 | -486 | -683 | -403 | -436 |
| 2011 | -402 | 1,795 | 73 | 40 | 679 | -468 | -563 | -1,490 | -1,312 | -218 | -336 | -1,293 |
| 2012 | -1,096 | -1,843 | -277 | 1,760 | 190 | -2,793 | 859 | -266 | -1,118 | -1,979 | -650 | -1,829 |
| 2013 | -672 | -1,189 | -1,241 | -1,212 | 356 | -750 | -2,032 | -922 | -2,647 | -1,607 | -2,648 | -1,852 |
| 2014 | -1,362 | -445 | 113 | -2,070 | -1,453 | -2,368 | -1,973 | -1,857 | -1,439 | -3,737 | -3,075 | -2,110 |
| 2015 | -882 | -1,337 | -1,637 | -2,155 | -4,044 | -3,886 | -3,182 | -1,253 | -1,980 | -1,284 | -1,959 | -3,033 |
| 2016 | -4,346 | -3,178 | -3,159 | -1,663 | -2,745 | -3,028 | -4,461 | -3,816 | -4,239 | -4,933 | -4,515 | -5,588 |
| 2017 | -4,985 | -3,719 | -4,638 | -4,310 | -5,542 | -4,901 | -5,050 | -4,724 | -5,031 | -5,955 | -6,385 | -6,784 |
| 2018 | -5,866 | -7,334 | -7,726 | -5,200 | -6,117 | -6,182 | -6,350 | -6,199 | -6,295 | -6,342 | -6,353 | -5,218 |
| 2019 | -6,378 | -5,783 | -5,730 | -5,128 | -7,111 | -5,523 | -4,456 | -6,117 | -4,955 | -7,377 | -6,744 | -5,193 |
| 2020 | -6,253 | -6,638 | -5,644 | -4,274 | -2,895 | -5,248 | -5,932 | -5,545 | -4,977 | -5,558 | -4,469 | -6,547 |
| 2021 | -6,520 | -3,674 | -7,244 | -5,970 | -6,476 | -5,994 | -6,030 | -6,508 | -6,439 | -7,570 | -6,716 | -6,557 |
| 2022 | -7,482 | -8,478 | -6,708 | -6,710 | -6,782 | -6,161 | -6,362 | -6,257 | -5,771 | -5,600 | -5,158 | -4,795 |
| 2023 | -5,514 | -4,051 | -6,947 | -7,254 | -8,654 | -8,551 | -9,028 | -9,603 | -8,127 | -9,250 | -7,579 | -7,895 |
| 2024 | -7,079 | -7,048 | -8,776 | -8,417 | -11,116 | -9,362 | ||||||
| - = No Data Reported; -- = Not Applicable; NA = Not Available; W = Withheld to avoid disclosure of individual company data. |
| Release Date: 8/30/2024 |
| Next Release Date: 9/30/2024 |