|
Download Data (XLS File) |
|
||||||||
|
||||||||
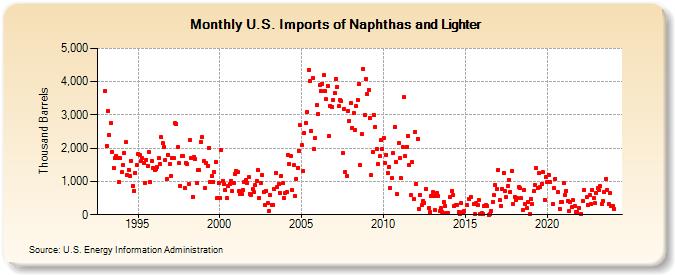
| U.S. Imports of Naphthas and Lighter (Thousand Barrels) | ||||||||
| Year | Jan | Feb | Mar | Apr | May | Jun | Jul | Aug | Sep | Oct | Nov | Dec |
|---|---|---|---|---|---|---|---|---|---|---|---|---|
| 1993 | 3,734 | 2,074 | 3,113 | 2,404 | 2,766 | 1,895 | 1,418 | 1,709 | 1,774 | 1,692 | 972 | 1,696 |
| 1994 | 1,282 | 1,495 | 1,867 | 2,175 | 1,203 | 1,357 | 1,168 | 1,624 | 863 | 722 | 1,265 | 1,480 |
| 1995 | 1,838 | 1,807 | 1,600 | 1,693 | 1,566 | 961 | 1,647 | 1,476 | 1,876 | 980 | 1,625 | 1,408 |
| 1996 | 1,339 | 1,372 | 1,447 | 1,694 | 1,528 | 2,326 | 2,143 | 2,036 | 1,644 | 1,070 | 1,800 | 1,524 |
| 1997 | 1,178 | 1,717 | 1,716 | 2,754 | 2,722 | 2,026 | 1,549 | 867 | 1,753 | 1,761 | 818 | 1,567 |
| 1998 | 1,525 | 927 | 2,248 | 1,719 | 540 | 1,736 | 1,668 | 964 | 1,336 | 1,339 | 2,200 | 2,325 |
| 1999 | 1,605 | 799 | 1,559 | 1,476 | 2,019 | 996 | 1,158 | 983 | 1,286 | 1,582 | 499 | 943 |
| 2000 | 507 | 1,947 | 1,028 | 926 | 736 | 507 | 856 | 925 | 1,021 | 706 | 945 | 1,228 |
| 2001 | 1,324 | 1,273 | 704 | 627 | 618 | 739 | 987 | 1,057 | 959 | 1,123 | 635 | 607 |
| 2002 | 762 | 685 | 879 | 1,027 | 1,348 | 511 | 951 | 1,201 | 688 | 291 | 722 | 342 |
| 2003 | 116 | 584 | 288 | 301 | 765 | 1,253 | 829 | 915 | 648 | 1,167 | 941 | 494 |
| 2004 | 639 | 682 | 1,789 | 1,537 | 1,753 | 739 | 1,480 | 562 | 1,059 | 1,413 | 1,929 | 2,683 |
| 2005 | 2,085 | 1,309 | 2,458 | 2,759 | 3,090 | 4,346 | 4,015 | 2,502 | 4,117 | 1,966 | 2,305 | 3,286 |
| 2006 | 3,024 | 3,885 | 3,718 | 3,941 | 4,200 | 3,717 | 3,465 | 3,875 | 2,369 | 3,270 | 3,252 | 3,448 |
| 2007 | 3,659 | 4,086 | 3,848 | 3,260 | 3,459 | 3,404 | 1,861 | 3,187 | 1,282 | 1,157 | 3,132 | 2,832 |
| 2008 | 3,360 | 2,617 | 3,054 | 2,555 | 3,263 | 3,459 | 3,941 | 1,490 | 2,426 | 4,393 | 3,006 | 4,087 |
| 2009 | 3,625 | 3,758 | 2,904 | 1,183 | 1,889 | 2,994 | 2,649 | 1,982 | 1,518 | 1,754 | 2,232 | 1,977 |
| 2010 | 2,320 | 1,551 | 1,809 | 1,268 | 1,444 | 807 | 1,102 | 1,862 | 2,640 | 1,582 | 610 | 2,143 |
| 2011 | 1,703 | 1,091 | 2,041 | 3,541 | 1,769 | 2,029 | 2,374 | 1,507 | 589 | 1,572 | 466 | 2,501 |
| 2012 | 936 | 2,280 | 185 | 595 | 280 | 421 | 361 | 782 | 195 | 67 | 570 | |
| 2013 | 669 | 553 | 130 | 648 | 559 | 105 | 189 | 92 | 374 | 274 | 40 | 54 |
| 2014 | 531 | 715 | 580 | 247 | 305 | 300 | 71 | 21 | 351 | 75 | 104 | |
| 2015 | 281 | 478 | 535 | 329 | 17 | 358 | 287 | 434 | 10 | |||
| 2016 | 45 | 36 | 277 | 293 | 258 | 5 | 18 | 109 | 386 | 579 | 889 | 786 |
| 2017 | 1,342 | 435 | 274 | 776 | 1,269 | 698 | 525 | 853 | 1,054 | 687 | 1,311 | 320 |
| 2018 | 543 | 454 | 488 | 831 | 790 | 489 | 138 | 749 | 328 | 190 | 387 | 18 |
| 2019 | 475 | 330 | 702 | 886 | 1,398 | 791 | 1,250 | 824 | 937 | 1,273 | 450 | 1,145 |
| 2020 | 993 | 1,203 | 975 | 334 | 807 | 1,082 | 680 | 181 | 369 | 376 | ||
| 2021 | 939 | 596 | 724 | 425 | 123 | 378 | 221 | 433 | 271 | 88 | 80 | 195 |
| 2022 | 33 | 424 | 750 | 529 | 305 | 582 | 311 | 746 | 495 | 344 | ||
| 2023 | 667 | 801 | 728 | 849 | 334 | 424 | 681 | 1,082 | 753 | 334 | 641 | 275 |
| 2024 | 275 | |||||||||||
| - = No Data Reported; -- = Not Applicable; NA = Not Available; W = Withheld to avoid disclosure of individual company data. |
| Release Date: 3/29/2024 |
| Next Release Date: 4/30/2024 |