|
Download Data (XLS File) |
|
||||||||
|
||||||||
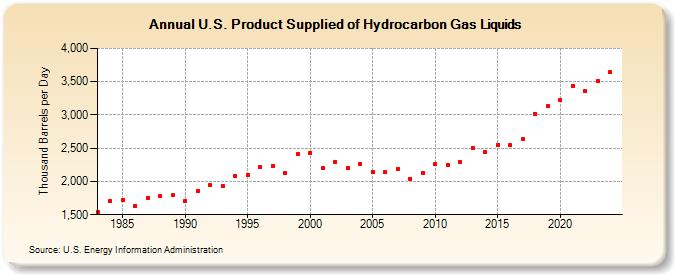
| U.S. Product Supplied of Hydrocarbon Gas Liquids (Thousand Barrels per Day) | ||||||||
| Decade | Year-0 | Year-1 | Year-2 | Year-3 | Year-4 | Year-5 | Year-6 | Year-7 | Year-8 | Year-9 |
|---|---|---|---|---|---|---|---|---|---|---|
| 1980's | 1,537 | 1,702 | 1,721 | 1,629 | 1,749 | 1,780 | 1,790 | |||
| 1990's | 1,705 | 1,863 | 1,946 | 1,931 | 2,081 | 2,100 | 2,222 | 2,233 | 2,126 | 2,411 |
| 2000's | 2,434 | 2,200 | 2,295 | 2,205 | 2,264 | 2,146 | 2,135 | 2,191 | 2,044 | 2,127 |
| 2010's | 2,263 | 2,250 | 2,293 | 2,501 | 2,443 | 2,550 | 2,541 | 2,637 | 3,014 | 3,139 |
| 2020's | 3,228 | 3,440 | 3,357 | 3,505 |
| - = No Data Reported; -- = Not Applicable; NA = Not Available; W = Withheld to avoid disclosure of individual company data. |
| Release Date: 8/30/2024 |
| Next Release Date: 8/29/2025 |