|
Download Data (XLS File) |
|
||||||||
|
||||||||
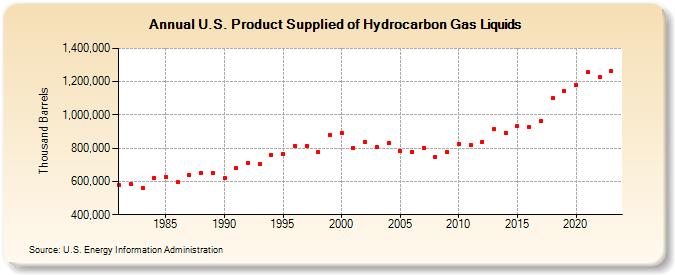
| U.S. Product Supplied of Hydrocarbon Gas Liquids (Thousand Barrels) | ||||||||
| Decade | Year-0 | Year-1 | Year-2 | Year-3 | Year-4 | Year-5 | Year-6 | Year-7 | Year-8 | Year-9 |
|---|---|---|---|---|---|---|---|---|---|---|
| 1980's | 577,511 | 583,872 | 561,073 | 622,765 | 628,330 | 594,445 | 638,489 | 651,308 | 653,317 | |
| 1990's | 622,149 | 679,975 | 712,248 | 704,839 | 759,408 | 766,419 | 813,180 | 814,997 | 776,153 | 880,174 |
| 2000's | 890,762 | 803,139 | 837,789 | 804,850 | 828,635 | 783,308 | 779,451 | 799,833 | 748,246 | 776,334 |
| 2010's | 825,879 | 821,345 | 839,282 | 912,806 | 891,630 | 930,667 | 929,942 | 962,528 | 1,099,970 | 1,145,706 |
| 2020's | 1,181,338 | 1,255,645 | 1,225,438 | 1,261,502 |
| - = No Data Reported; -- = Not Applicable; NA = Not Available; W = Withheld to avoid disclosure of individual company data. |
| Release Date: 3/29/2024 |
| Next Release Date: 8/30/2024 |