|
Download Data (XLS File) |
|
||||||||
|
||||||||
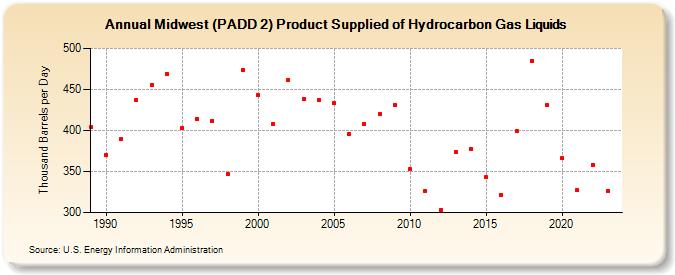
| Midwest (PADD 2) Product Supplied of Hydrocarbon Gas Liquids (Thousand Barrels per Day) | ||||||||
| Decade | Year-0 | Year-1 | Year-2 | Year-3 | Year-4 | Year-5 | Year-6 | Year-7 | Year-8 | Year-9 |
|---|---|---|---|---|---|---|---|---|---|---|
| 1980's | 404 | |||||||||
| 1990's | 370 | 390 | 437 | 455 | 469 | 403 | 414 | 412 | 347 | 474 |
| 2000's | 443 | 408 | 462 | 438 | 437 | 433 | 396 | 408 | 420 | 431 |
| 2010's | 353 | 326 | 303 | 374 | 377 | 343 | 322 | 399 | 485 | 431 |
| 2020's | 366 | 327 | 358 | 326 |
| - = No Data Reported; -- = Not Applicable; NA = Not Available; W = Withheld to avoid disclosure of individual company data. |
| Release Date: 3/29/2024 |
| Next Release Date: 8/30/2024 |