|
Download Data (XLS File) |
|
||||||||
|
||||||||
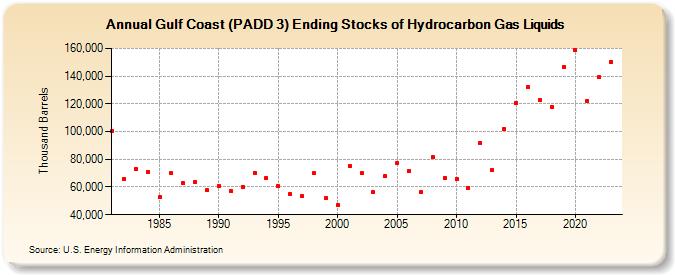
| Gulf Coast (PADD 3) Ending Stocks of Hydrocarbon Gas Liquids (Thousand Barrels) | ||||||||
| Decade | Year-0 | Year-1 | Year-2 | Year-3 | Year-4 | Year-5 | Year-6 | Year-7 | Year-8 | Year-9 |
|---|---|---|---|---|---|---|---|---|---|---|
| 1980's | 100,055 | 66,095 | 73,228 | 70,749 | 52,497 | 69,866 | 62,526 | 63,258 | 57,696 | |
| 1990's | 60,562 | 56,879 | 60,133 | 70,292 | 66,419 | 60,398 | 54,962 | 53,310 | 69,751 | 52,011 |
| 2000's | 47,079 | 75,216 | 69,902 | 56,049 | 67,667 | 76,986 | 71,673 | 56,377 | 81,421 | 66,837 |
| 2010's | 65,854 | 59,463 | 91,820 | 72,323 | 101,920 | 120,820 | 132,049 | 122,737 | 117,714 | 146,795 |
| 2020's | 158,556 | 122,051 | 139,033 | 150,406 |
| - = No Data Reported; -- = Not Applicable; NA = Not Available; W = Withheld to avoid disclosure of individual company data. |
| Release Date: 4/30/2024 |
| Next Release Date: 8/30/2024 |