|
Download Data (XLS File) |
|
||||||||
|
||||||||
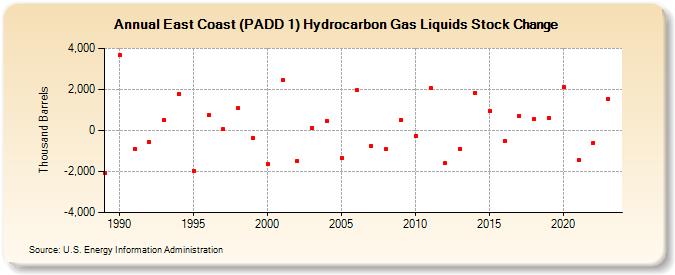
| East Coast (PADD 1) Hydrocarbon Gas Liquids Stock Change (Thousand Barrels) | ||||||||
| Decade | Year-0 | Year-1 | Year-2 | Year-3 | Year-4 | Year-5 | Year-6 | Year-7 | Year-8 | Year-9 |
|---|---|---|---|---|---|---|---|---|---|---|
| 1980's | -2,049 | |||||||||
| 1990's | 3,654 | -910 | -553 | 518 | 1,777 | -1,962 | 732 | 53 | 1,077 | -357 |
| 2000's | -1,649 | 2,436 | -1,473 | 125 | 462 | -1,324 | 1,958 | -766 | -922 | 528 |
| 2010's | -272 | 2,050 | -1,588 | -890 | 1,845 | 950 | -515 | 716 | 554 | 605 |
| 2020's | 2,117 | -1,456 | -595 | 1,524 |
| - = No Data Reported; -- = Not Applicable; NA = Not Available; W = Withheld to avoid disclosure of individual company data. |
| Release Date: 4/30/2024 |
| Next Release Date: 8/30/2024 |