|
Download Data (XLS File) |
|
||||||||
|
||||||||
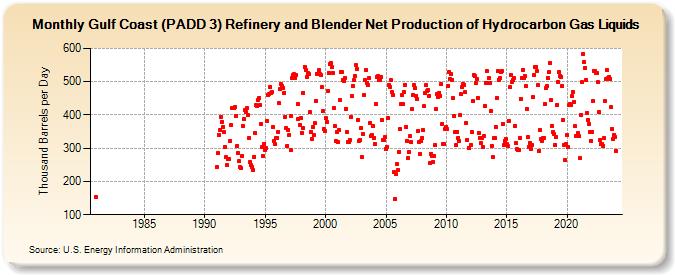
| Gulf Coast (PADD 3) Refinery and Blender Net Production of Hydrocarbon Gas Liquids (Thousand Barrels per Day) | ||||||||
| Year | Jan | Feb | Mar | Apr | May | Jun | Jul | Aug | Sep | Oct | Nov | Dec |
|---|---|---|---|---|---|---|---|---|---|---|---|---|
| 1981 | 152 | |||||||||||
| 1991 | 243 | 285 | 340 | 355 | 395 | 380 | 365 | 349 | 303 | 272 | 249 | 266 |
| 1992 | 267 | 322 | 369 | 420 | 422 | 420 | 425 | 398 | 307 | 286 | 260 | 243 |
| 1993 | 239 | 277 | 368 | 389 | 414 | 409 | 420 | 399 | 331 | 259 | 248 | 243 |
| 1994 | 235 | 275 | 346 | 430 | 427 | 445 | 451 | 429 | 373 | 303 | 276 | 314 |
| 1995 | 294 | 300 | 381 | 460 | 464 | 485 | 467 | 468 | 364 | 323 | 312 | 330 |
| 1996 | 332 | 350 | 435 | 478 | 492 | 487 | 482 | 467 | 395 | 360 | 308 | 356 |
| 1997 | 339 | 294 | 398 | 512 | 520 | 522 | 512 | 519 | 433 | 389 | 370 | 390 |
| 1998 | 347 | 360 | 467 | 545 | 534 | 514 | 525 | 523 | 408 | 348 | 329 | 363 |
| 1999 | 339 | 375 | 443 | 524 | 522 | 534 | 522 | 521 | 483 | 411 | 358 | 352 |
| 2000 | 390 | 378 | 473 | 527 | 553 | 556 | 543 | 527 | 421 | 367 | 323 | 348 |
| 2001 | 318 | 354 | 444 | 529 | 528 | 504 | 503 | 511 | 419 | 348 | 319 | 320 |
| 2002 | 324 | 393 | 456 | 488 | 504 | 518 | 549 | 538 | 385 | 322 | 326 | 361 |
| 2003 | 273 | 344 | 459 | 505 | 536 | 497 | 489 | 511 | 376 | 337 | 340 | 366 |
| 2004 | 332 | 314 | 432 | 514 | 516 | 504 | 505 | 515 | 386 | 325 | 325 | 334 |
| 2005 | 299 | 305 | 390 | 490 | 485 | 504 | 469 | 459 | 228 | 148 | 221 | 251 |
| 2006 | 234 | 290 | 358 | 433 | 459 | 433 | 470 | 491 | 364 | 322 | 271 | 289 |
| 2007 | 336 | 318 | 417 | 461 | 489 | 480 | 457 | 448 | 353 | 320 | 283 | 321 |
| 2008 | 331 | 354 | 426 | 465 | 489 | 473 | 475 | 458 | 256 | 284 | 277 | 258 |
| 2009 | 278 | 309 | 417 | 464 | 454 | 466 | 458 | 492 | 374 | 314 | 312 | 358 |
| 2010 | 365 | 358 | 488 | 529 | 508 | 523 | 506 | 450 | 396 | 350 | 310 | 350 |
| 2011 | 332 | 323 | 399 | 462 | 485 | 493 | 490 | 468 | 376 | 326 | 302 | 300 |
| 2012 | 311 | 348 | 441 | 520 | 516 | 496 | 509 | 452 | 347 | 332 | 315 | 332 |
| 2013 | 305 | 338 | 427 | 497 | 532 | 497 | 511 | 496 | 411 | 307 | 273 | 330 |
| 2014 | 332 | 364 | 452 | 531 | 506 | 510 | 530 | 531 | 374 | 310 | 323 | 328 |
| 2015 | 314 | 308 | 383 | 483 | 521 | 500 | 505 | 510 | 366 | 315 | 297 | 294 |
| 2016 | 296 | 332 | 449 | 511 | 535 | 510 | 517 | 486 | 419 | 333 | 305 | 316 |
| 2017 | 298 | 309 | 453 | 520 | 544 | 545 | 531 | 490 | 293 | 354 | 329 | 323 |
| 2018 | 330 | 332 | 434 | 481 | 488 | 512 | 528 | 557 | 445 | 367 | 350 | 342 |
| 2019 | 310 | 334 | 430 | 500 | 529 | 518 | 514 | 488 | 384 | 311 | 265 | 313 |
| 2020 | 339 | 303 | 429 | 434 | 429 | 456 | 470 | 440 | 366 | 336 | 337 | 345 |
| 2021 | 336 | 269 | 401 | 498 | 584 | 559 | 542 | 505 | 407 | 386 | 372 | 349 |
| 2022 | 323 | 350 | 441 | 532 | 532 | 527 | 526 | 498 | 409 | 325 | 312 | 313 |
| 2023 | 308 | 330 | 441 | 508 | 535 | 510 | 515 | 508 | 423 | 359 | 327 | 340 |
| 2024 | 335 | |||||||||||
| - = No Data Reported; -- = Not Applicable; NA = Not Available; W = Withheld to avoid disclosure of individual company data. |
| Release Date: 3/29/2024 |
| Next Release Date: 4/30/2024 |