|
Download Data (XLS File) |
|
||||||||
|
||||||||
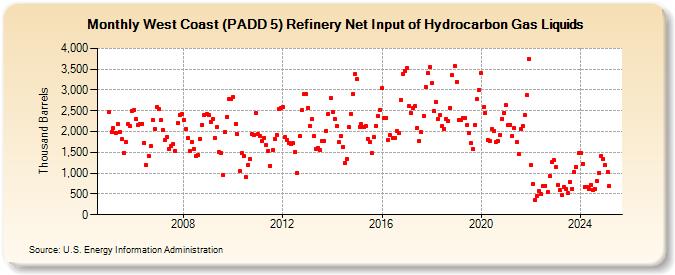
| West Coast (PADD 5) Refinery Net Input of Hydrocarbon Gas Liquids (Thousand Barrels) | ||||||||
| Year | Jan | Feb | Mar | Apr | May | Jun | Jul | Aug | Sep | Oct | Nov | Dec |
|---|---|---|---|---|---|---|---|---|---|---|---|---|
| 2005 | 2,469 | 1,996 | 2,077 | 1,967 | 2,190 | 1,994 | 1,819 | 1,495 | 1,750 | 2,170 | 2,125 | 2,492 |
| 2006 | 2,519 | 2,300 | 2,162 | 2,184 | 2,190 | 1,725 | 1,194 | 1,424 | 1,652 | 2,282 | 2,066 | 2,589 |
| 2007 | 2,532 | 2,272 | 2,034 | 1,797 | 1,872 | 1,591 | 1,646 | 1,700 | 1,538 | 2,199 | 2,394 | 2,418 |
| 2008 | 2,281 | 2,061 | 1,843 | 1,533 | 1,760 | 1,586 | 1,405 | 1,430 | 1,829 | 2,169 | 2,389 | 2,415 |
| 2009 | 2,393 | 2,237 | 2,305 | 1,853 | 2,118 | 1,501 | 1,489 | 958 | 1,989 | 2,359 | 2,776 | 2,772 |
| 2010 | 2,831 | 2,185 | 1,931 | 1,044 | 1,473 | 1,403 | 900 | 1,202 | 1,331 | 1,932 | 1,921 | 2,435 |
| 2011 | 1,934 | 1,885 | 1,782 | 1,851 | 1,675 | 1,534 | 1,178 | 1,547 | 1,821 | 1,920 | 2,538 | 2,572 |
| 2012 | 2,587 | 1,869 | 1,794 | 1,726 | 1,689 | 1,719 | 1,515 | 1,010 | 1,882 | 2,511 | 2,900 | 2,906 |
| 2013 | 2,561 | 2,143 | 2,290 | 1,886 | 1,576 | 1,610 | 1,554 | 1,773 | 1,782 | 2,025 | 2,419 | 2,800 |
| 2014 | 2,469 | 2,302 | 2,138 | 1,743 | 1,894 | 1,633 | 1,254 | 1,341 | 2,098 | 2,427 | 2,904 | 3,390 |
| 2015 | 3,253 | 2,110 | 2,171 | 2,108 | 2,126 | 1,823 | 1,750 | 1,477 | 1,867 | 2,144 | 2,377 | 2,530 |
| 2016 | 3,039 | 2,337 | 2,321 | 1,801 | 1,915 | 1,841 | 1,855 | 2,019 | 1,961 | 2,766 | 3,380 | 3,456 |
| 2017 | 3,525 | 2,623 | 2,448 | 2,575 | 2,614 | 2,088 | 1,768 | 1,983 | 2,374 | 3,065 | 3,413 | 3,549 |
| 2018 | 3,159 | 2,483 | 2,713 | 2,298 | 2,390 | 2,133 | 2,062 | 2,304 | 2,251 | 2,566 | 3,355 | 3,572 |
| 2019 | 3,200 | 2,274 | 2,278 | 2,328 | 2,335 | 2,159 | 1,975 | 1,721 | 1,586 | 2,159 | 2,771 | 3,001 |
| 2020 | 3,400 | 2,580 | 2,454 | 1,800 | 1,775 | 2,061 | 2,015 | 1,758 | 1,767 | 1,927 | 2,313 | 2,452 |
| 2021 | 2,630 | 2,149 | 2,167 | 1,895 | 2,090 | 1,750 | 1,468 | 2,051 | 2,128 | 2,399 | 2,871 | 3,756 |
| 2022 | 1,191 | 741 | 361 | 459 | 560 | 489 | 690 | 699 | 545 | 928 | 1,257 | 1,307 |
| 2023 | 1,136 | 710 | 583 | 471 | 674 | 617 | 515 | 795 | 623 | 1,023 | 1,141 | 1,478 |
| 2024 | 1,492 | |||||||||||
| - = No Data Reported; -- = Not Applicable; NA = Not Available; W = Withheld to avoid disclosure of individual company data. |
| Release Date: 3/29/2024 |
| Next Release Date: 4/30/2024 |
Referring Pages: