|
Download Data (XLS File) |
|
||||||||
|
||||||||
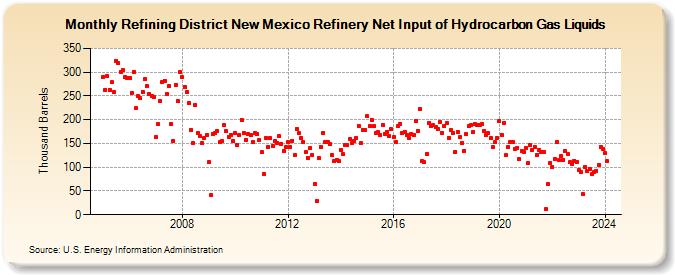
| Refining District New Mexico Refinery Net Input of Hydrocarbon Gas Liquids (Thousand Barrels) | ||||||||
| Year | Jan | Feb | Mar | Apr | May | Jun | Jul | Aug | Sep | Oct | Nov | Dec |
|---|---|---|---|---|---|---|---|---|---|---|---|---|
| 2005 | 290 | 263 | 291 | 263 | 279 | 258 | 324 | 319 | 301 | 304 | 290 | 288 |
| 2006 | 288 | 257 | 301 | 224 | 249 | 245 | 259 | 285 | 271 | 254 | 250 | 247 |
| 2007 | 163 | 190 | 240 | 279 | 282 | 255 | 271 | 191 | 156 | 273 | 239 | 300 |
| 2008 | 289 | 269 | 259 | 235 | 179 | 151 | 231 | 172 | 165 | 150 | 162 | 168 |
| 2009 | 110 | 42 | 170 | 173 | 176 | 152 | 155 | 189 | 176 | 164 | 168 | 155 |
| 2010 | 172 | 146 | 168 | 200 | 172 | 158 | 169 | 168 | 153 | 173 | 170 | 158 |
| 2011 | 131 | 86 | 162 | 143 | 161 | 145 | 155 | 151 | 165 | 149 | 135 | 143 |
| 2012 | 152 | 143 | 156 | 125 | 181 | 171 | 162 | 153 | 132 | 120 | 140 | 125 |
| 2013 | 65 | 29 | 119 | 142 | 173 | 154 | 153 | 148 | 125 | 112 | 115 | 112 |
| 2014 | 137 | 127 | 146 | 146 | 159 | 150 | 156 | 161 | 187 | 150 | 179 | 179 |
| 2015 | 207 | 187 | 200 | 186 | 173 | 174 | 167 | 189 | 170 | 175 | 165 | 180 |
| 2016 | 163 | 154 | 187 | 191 | 171 | 175 | 168 | 161 | 170 | 168 | 198 | 177 |
| 2017 | 222 | 112 | 110 | 128 | 194 | 187 | 188 | 184 | 181 | 195 | 173 | 186 |
| 2018 | 192 | 162 | 178 | 173 | 133 | 175 | 163 | 151 | 135 | 169 | 186 | 188 |
| 2019 | 174 | 190 | 188 | 188 | 190 | 177 | 167 | 171 | 161 | 143 | 152 | 161 |
| 2020 | 197 | 168 | 194 | 125 | 143 | 154 | 153 | 139 | 141 | 117 | 134 | 131 |
| 2021 | 141 | 108 | 146 | 137 | 142 | 126 | 137 | 133 | 131 | 11 | 64 | 109 |
| 2022 | 100 | 117 | 153 | 115 | 123 | 116 | 134 | 128 | 110 | 106 | 114 | 111 |
| 2023 | 94 | 90 | 43 | 100 | 92 | 97 | 85 | 89 | 93 | 105 | 143 | 138 |
| 2024 | 129 | |||||||||||
| - = No Data Reported; -- = Not Applicable; NA = Not Available; W = Withheld to avoid disclosure of individual company data. |
| Release Date: 3/29/2024 |
| Next Release Date: 4/30/2024 |