|
Download Data (XLS File) |
|
||||||||
|
||||||||
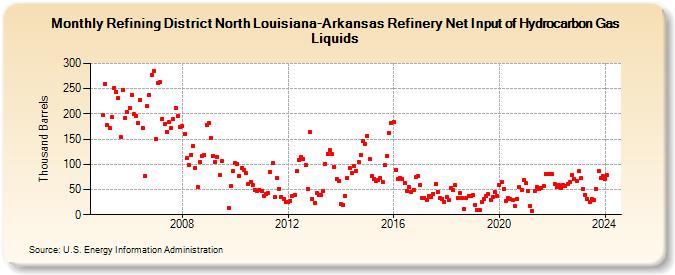
| Refining District North Louisiana-Arkansas Refinery Net Input of Hydrocarbon Gas Liquids (Thousand Barrels) | ||||||||
| Year | Jan | Feb | Mar | Apr | May | Jun | Jul | Aug | Sep | Oct | Nov | Dec |
|---|---|---|---|---|---|---|---|---|---|---|---|---|
| 2005 | 197 | 260 | 177 | 172 | 193 | 252 | 244 | 232 | 155 | 248 | 192 | 203 |
| 2006 | 212 | 237 | 199 | 196 | 182 | 227 | 172 | 77 | 215 | 237 | 277 | 286 |
| 2007 | 150 | 262 | 263 | 190 | 179 | 165 | 183 | 173 | 189 | 212 | 196 | 174 |
| 2008 | 175 | 160 | 112 | 98 | 119 | 136 | 93 | 55 | 105 | 117 | 118 | 178 |
| 2009 | 181 | 152 | 117 | 105 | 115 | 78 | 106 | 14 | 57 | 86 | ||
| 2010 | 102 | 101 | 77 | 93 | 89 | 82 | 60 | 65 | 58 | 49 | 47 | 50 |
| 2011 | 47 | 38 | 41 | 43 | 85 | 102 | 35 | 73 | 52 | 36 | 31 | 25 |
| 2012 | 25 | 28 | 37 | 39 | 86 | 109 | 115 | 111 | 98 | 52 | 164 | 32 |
| 2013 | 23 | 43 | 40 | 39 | 47 | 101 | 121 | 128 | 121 | 95 | 71 | 67 |
| 2014 | 22 | 19 | 38 | 73 | 92 | 83 | 96 | 87 | 105 | 119 | 146 | 140 |
| 2015 | 157 | 110 | 76 | 71 | 67 | 69 | 72 | 65 | 98 | 117 | 162 | 182 |
| 2016 | 184 | 89 | 71 | 73 | 71 | 63 | 47 | 54 | 45 | 50 | 74 | 76 |
| 2017 | 59 | 33 | 34 | 29 | 38 | 35 | 42 | 60 | 46 | 33 | 32 | 25 |
| 2018 | 36 | 29 | 53 | 49 | 59 | 33 | 43 | 34 | 11 | 34 | 38 | 37 |
| 2019 | 39 | 19 | 9 | 10 | 25 | 31 | 37 | 41 | 30 | 36 | 45 | 38 |
| 2020 | 59 | 65 | 51 | 27 | 33 | 31 | 30 | 17 | 32 | 55 | 49 | 69 |
| 2021 | 62 | 48 | 18 | 8 | 47 | 54 | 52 | 53 | 57 | 81 | 80 | 81 |
| 2022 | 80 | 60 | 54 | 59 | 53 | 58 | 57 | 61 | 65 | 79 | 71 | 67 |
| 2023 | 86 | 72 | 51 | 40 | 32 | 26 | 32 | 30 | 52 | 86 | 72 | 76 |
| 2024 | 71 | 78 | ||||||||||
| - = No Data Reported; -- = Not Applicable; NA = Not Available; W = Withheld to avoid disclosure of individual company data. |
| Release Date: 4/30/2024 |
| Next Release Date: 5/31/2024 |