|
Download Data (XLS File) |
|
||||||||
|
||||||||
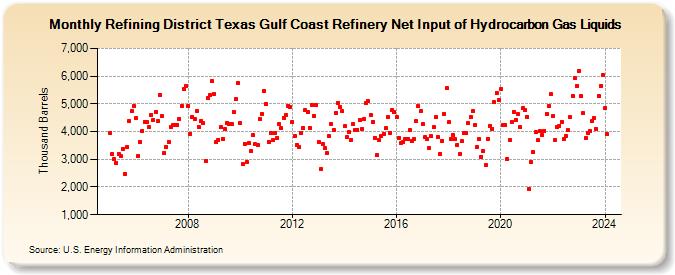
| Refining District Texas Gulf Coast Refinery Net Input of Hydrocarbon Gas Liquids (Thousand Barrels) | ||||||||
| Year | Jan | Feb | Mar | Apr | May | Jun | Jul | Aug | Sep | Oct | Nov | Dec |
|---|---|---|---|---|---|---|---|---|---|---|---|---|
| 2005 | 3,938 | 3,185 | 3,014 | 2,866 | 3,195 | 3,108 | 3,383 | 2,473 | 3,435 | 4,374 | 4,738 | 4,915 |
| 2006 | 4,495 | 3,119 | 3,618 | 4,014 | 4,358 | 4,344 | 4,172 | 4,611 | 4,419 | 4,719 | 4,375 | 5,324 |
| 2007 | 4,546 | 3,229 | 3,447 | 3,632 | 4,175 | 4,221 | 4,250 | 4,246 | 4,462 | 4,936 | 5,533 | 5,629 |
| 2008 | 4,935 | 3,921 | 4,535 | 4,462 | 4,756 | 4,159 | 4,383 | 4,305 | 2,934 | 5,212 | 5,315 | 5,829 |
| 2009 | 5,357 | 3,626 | 3,708 | 4,149 | 3,732 | 4,090 | 4,310 | 4,270 | 4,267 | 4,718 | 5,173 | 5,760 |
| 2010 | 4,297 | 2,817 | 3,567 | 2,904 | 3,579 | 3,295 | 3,858 | 3,533 | 3,517 | 4,437 | 4,644 | 5,462 |
| 2011 | 4,985 | 3,626 | 3,963 | 3,682 | 3,948 | 3,772 | 4,259 | 4,118 | 4,498 | 4,597 | 4,938 | 4,902 |
| 2012 | 4,347 | 3,829 | 3,528 | 3,444 | 3,960 | 4,145 | 4,761 | 4,689 | 4,143 | 4,971 | 4,576 | 4,960 |
| 2013 | 3,615 | 2,647 | 3,546 | 3,393 | 3,219 | 3,833 | 4,269 | 4,070 | 4,682 | 5,044 | 4,895 | 4,724 |
| 2014 | 4,185 | 3,799 | 3,972 | 3,701 | 4,271 | 4,061 | 4,072 | 4,416 | 4,096 | 4,445 | 5,020 | 5,093 |
| 2015 | 4,603 | 4,357 | 3,780 | 3,144 | 3,685 | 3,834 | 3,913 | 4,122 | 4,528 | 3,957 | 4,765 | 4,690 |
| 2016 | 4,528 | 3,783 | 3,570 | 3,637 | 3,745 | 3,741 | 4,046 | 3,668 | 3,742 | 4,368 | 4,917 | 4,725 |
| 2017 | 4,259 | 3,788 | 3,731 | 3,406 | 3,823 | 4,152 | 4,521 | 3,803 | 3,208 | 3,677 | 4,629 | 5,571 |
| 2018 | 4,331 | 3,721 | 3,867 | 3,715 | 3,523 | 3,174 | 3,648 | 3,937 | 3,934 | 4,294 | 4,533 | 4,734 |
| 2019 | 4,242 | 3,448 | 3,714 | 3,093 | 3,290 | 2,776 | 3,742 | 4,218 | 4,107 | 5,064 | 5,407 | 5,154 |
| 2020 | 5,529 | 4,223 | 4,238 | 3,009 | 3,686 | 4,348 | 4,720 | 4,430 | 4,622 | 4,154 | 4,834 | 4,779 |
| 2021 | 4,542 | 1,919 | 2,890 | 3,258 | 3,967 | 3,679 | 4,004 | 3,881 | 4,035 | 4,635 | 4,911 | 5,343 |
| 2022 | 4,548 | 3,678 | 4,161 | 4,215 | 4,354 | 3,727 | 3,835 | 4,045 | 4,513 | 5,289 | 5,936 | 5,659 |
| 2023 | 6,192 | 5,271 | 4,654 | 3,763 | 3,958 | 4,013 | 4,384 | 4,494 | 4,086 | 5,291 | 5,639 | 6,034 |
| 2024 | 4,858 | |||||||||||
| - = No Data Reported; -- = Not Applicable; NA = Not Available; W = Withheld to avoid disclosure of individual company data. |
| Release Date: 3/29/2024 |
| Next Release Date: 4/30/2024 |