|
Download Data (XLS File) |
|
||||||||
|
||||||||
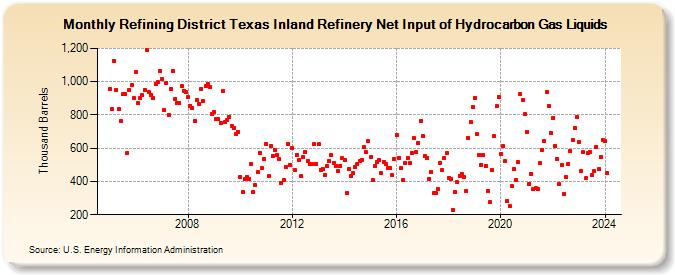
| Refining District Texas Inland Refinery Net Input of Hydrocarbon Gas Liquids (Thousand Barrels) | ||||||||
| Year | Jan | Feb | Mar | Apr | May | Jun | Jul | Aug | Sep | Oct | Nov | Dec |
|---|---|---|---|---|---|---|---|---|---|---|---|---|
| 2005 | 957 | 837 | 1,127 | 952 | 833 | 763 | 925 | 925 | 572 | 948 | 982 | 899 |
| 2006 | 1,059 | 869 | 901 | 918 | 951 | 1,193 | 935 | 920 | 900 | 988 | 996 | 1,065 |
| 2007 | 1,015 | 827 | 992 | 800 | 955 | 1,067 | 897 | 871 | 871 | 974 | 944 | 935 |
| 2008 | 905 | 856 | 843 | 766 | 887 | 867 | 955 | 882 | 971 | 986 | 965 | 804 |
| 2009 | 819 | 778 | 778 | 751 | 945 | 756 | 772 | 789 | 734 | 720 | 683 | 699 |
| 2010 | 429 | 336 | 412 | 425 | 413 | 506 | 337 | 376 | 454 | 573 | 481 | 535 |
| 2011 | 625 | 431 | 613 | 554 | 592 | 562 | 536 | 390 | 408 | 486 | 627 | 501 |
| 2012 | 600 | 468 | 559 | 528 | 431 | 545 | 577 | 524 | 504 | 505 | 623 | 504 |
| 2013 | 623 | 471 | 474 | 441 | 490 | 523 | 559 | 513 | 495 | 461 | 495 | 538 |
| 2014 | 528 | 329 | 476 | 434 | 448 | 485 | 505 | 522 | 531 | 605 | 575 | 641 |
| 2015 | 546 | 407 | 493 | 515 | 526 | 450 | 518 | 503 | 480 | 478 | 437 | 532 |
| 2016 | 681 | 543 | 480 | 407 | 513 | 538 | 508 | 571 | 660 | 577 | 634 | 761 |
| 2017 | 671 | 553 | 539 | 417 | 457 | 331 | 333 | 353 | 512 | 470 | 538 | 570 |
| 2018 | 422 | 417 | 228 | 339 | 394 | 435 | 447 | 429 | 341 | 663 | 757 | 847 |
| 2019 | 902 | 683 | 562 | 501 | 559 | 492 | 345 | 274 | 468 | 673 | 853 | 910 |
| 2020 | 564 | 612 | 521 | 281 | 252 | 373 | 474 | 409 | 515 | 923 | 892 | 803 |
| 2021 | 696 | 385 | 447 | 355 | 359 | 352 | 510 | 590 | 641 | 939 | 855 | 693 |
| 2022 | 784 | 616 | 537 | 384 | 499 | 326 | 424 | 507 | 582 | 651 | 721 | 786 |
| 2023 | 635 | 465 | 575 | 419 | 572 | 578 | 436 | 462 | 609 | 472 | 547 | 647 |
| 2024 | 643 | |||||||||||
| - = No Data Reported; -- = Not Applicable; NA = Not Available; W = Withheld to avoid disclosure of individual company data. |
| Release Date: 3/29/2024 |
| Next Release Date: 4/30/2024 |