|
Download Data (XLS File) |
|
||||||||
|
||||||||
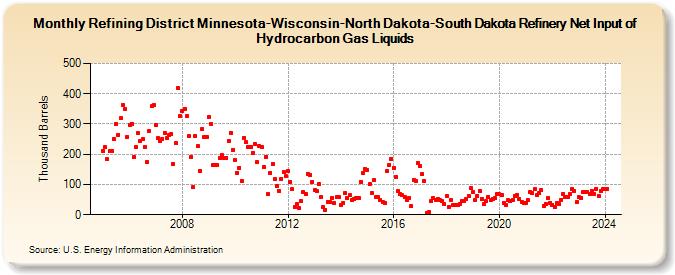
| Refining District Minnesota-Wisconsin-North Dakota-South Dakota Refinery Net Input of Hydrocarbon Gas Liquids (Thousand Barrels) | ||||||||
| Year | Jan | Feb | Mar | Apr | May | Jun | Jul | Aug | Sep | Oct | Nov | Dec |
|---|---|---|---|---|---|---|---|---|---|---|---|---|
| 2005 | 211 | 223 | 183 | 210 | 210 | 251 | 299 | 265 | 319 | 362 | 351 | 257 |
| 2006 | 298 | 301 | 192 | 223 | 269 | 245 | 249 | 224 | 173 | 277 | 358 | 363 |
| 2007 | 296 | 252 | 243 | 251 | 271 | 253 | 262 | 267 | 169 | 236 | 420 | 326 |
| 2008 | 343 | 350 | 325 | 259 | 191 | 91 | 260 | 226 | 144 | 284 | 258 | 256 |
| 2009 | 322 | 300 | 165 | 166 | 163 | 189 | 196 | 188 | 188 | 244 | 271 | 215 |
| 2010 | 181 | 139 | 156 | 111 | 255 | 239 | 225 | 224 | 205 | 235 | 173 | 227 |
| 2011 | 224 | 158 | 192 | 67 | 139 | 168 | 118 | 95 | 79 | 119 | 141 | 127 |
| 2012 | 144 | 108 | 84 | 25 | 35 | 22 | 45 | 75 | 69 | 136 | 132 | 109 |
| 2013 | 81 | 77 | 102 | 58 | 25 | 16 | 43 | 41 | 56 | 38 | 58 | 58 |
| 2014 | 33 | 40 | 71 | 54 | 64 | 48 | 53 | 54 | 55 | 109 | 139 | 151 |
| 2015 | 148 | 101 | 71 | 114 | 59 | 58 | 47 | 41 | 39 | 145 | 166 | 185 |
| 2016 | 155 | 126 | 77 | 69 | 64 | 59 | 50 | 56 | 28 | 114 | 110 | 172 |
| 2017 | 161 | 134 | 111 | 6 | 8 | 45 | 54 | 49 | 53 | 47 | 44 | 34 |
| 2018 | 63 | 26 | 49 | 33 | 32 | 31 | 36 | 45 | 44 | 53 | 62 | 87 |
| 2019 | 75 | 49 | 63 | 80 | 53 | 34 | 44 | 59 | 50 | 53 | 55 | 68 |
| 2020 | 67 | 64 | 40 | 32 | 47 | 45 | 49 | 62 | 66 | 52 | 43 | 38 |
| 2021 | 40 | 47 | 74 | 72 | 84 | 64 | 71 | 82 | 30 | 36 | 54 | 40 |
| 2022 | 33 | 27 | 38 | 37 | 50 | 69 | 60 | 60 | 70 | 86 | 79 | 42 |
| 2023 | 57 | 56 | 74 | 75 | 75 | 69 | 79 | 70 | 86 | 62 | 78 | 85 |
| 2024 | 85 | |||||||||||
| - = No Data Reported; -- = Not Applicable; NA = Not Available; W = Withheld to avoid disclosure of individual company data. |
| Release Date: 3/29/2024 |
| Next Release Date: 4/30/2024 |