|
Download Data (XLS File) |
|
||||||||
|
||||||||
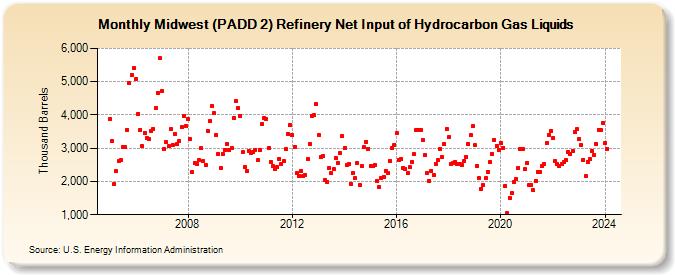
| Midwest (PADD 2) Refinery Net Input of Hydrocarbon Gas Liquids (Thousand Barrels) | ||||||||
| Year | Jan | Feb | Mar | Apr | May | Jun | Jul | Aug | Sep | Oct | Nov | Dec |
|---|---|---|---|---|---|---|---|---|---|---|---|---|
| 2005 | 3,872 | 3,209 | 1,922 | 2,306 | 2,621 | 2,635 | 3,025 | 3,022 | 3,557 | 4,953 | 5,200 | 5,407 |
| 2006 | 5,082 | 4,036 | 3,556 | 3,052 | 3,469 | 3,313 | 3,279 | 3,502 | 3,573 | 4,193 | 4,669 | 5,707 |
| 2007 | 4,724 | 2,988 | 3,179 | 3,058 | 3,569 | 3,107 | 3,433 | 3,117 | 3,202 | 3,637 | 3,964 | 3,669 |
| 2008 | 3,869 | 3,263 | 2,275 | 2,561 | 2,527 | 2,644 | 2,991 | 2,600 | 2,499 | 3,526 | 3,810 | 4,268 |
| 2009 | 4,047 | 3,382 | 2,819 | 2,402 | 2,826 | 2,949 | 3,139 | 2,931 | 3,006 | 3,903 | 4,405 | 4,207 |
| 2010 | 3,980 | 2,885 | 2,438 | 2,324 | 2,925 | 2,864 | 2,871 | 2,957 | 2,635 | 2,937 | 3,733 | 3,917 |
| 2011 | 3,879 | 3,006 | 2,599 | 2,457 | 2,360 | 2,447 | 2,686 | 2,524 | 2,604 | 2,975 | 3,434 | 3,701 |
| 2012 | 3,395 | 3,045 | 2,253 | 2,173 | 2,313 | 2,176 | 2,197 | 2,662 | 3,137 | 3,979 | 3,989 | 4,327 |
| 2013 | 3,390 | 2,734 | 2,772 | 2,039 | 1,990 | 2,417 | 2,241 | 2,365 | 2,712 | 2,562 | 2,846 | 3,367 |
| 2014 | 2,998 | 2,508 | 2,510 | 1,936 | 2,252 | 2,092 | 2,561 | 1,892 | 2,462 | 3,023 | 3,195 | 2,985 |
| 2015 | 2,476 | 2,470 | 2,481 | 2,013 | 1,834 | 2,099 | 2,147 | 2,322 | 2,265 | 2,629 | 3,015 | 3,104 |
| 2016 | 3,456 | 2,647 | 2,686 | 2,406 | 2,381 | 2,246 | 2,422 | 2,581 | 2,811 | 3,549 | 3,560 | 3,560 |
| 2017 | 3,241 | 2,785 | 2,240 | 2,027 | 2,329 | 2,193 | 2,530 | 2,635 | 2,976 | 2,734 | 3,129 | 3,587 |
| 2018 | 3,322 | 2,533 | 2,545 | 2,597 | 2,529 | 2,513 | 2,480 | 2,622 | 2,749 | 3,126 | 3,390 | 3,661 |
| 2019 | 3,088 | 2,476 | 2,096 | 1,787 | 1,895 | 2,094 | 2,298 | 2,584 | 2,838 | 3,252 | 3,075 | 2,953 |
| 2020 | 3,167 | 3,014 | 1,868 | 1,042 | 1,512 | 1,643 | 1,981 | 2,062 | 2,414 | 2,965 | 2,982 | 2,366 |
| 2021 | 2,568 | 1,885 | 1,899 | 1,729 | 2,019 | 2,297 | 2,291 | 2,462 | 2,523 | 3,148 | 3,404 | 3,519 |
| 2022 | 3,304 | 2,614 | 2,520 | 2,464 | 2,527 | 2,582 | 2,639 | 2,891 | 2,825 | 2,911 | 3,480 | 3,569 |
| 2023 | 3,266 | 3,091 | 2,655 | 2,163 | 2,585 | 2,664 | 2,928 | 2,797 | 3,126 | 3,559 | 3,538 | 3,765 |
| 2024 | 3,160 | |||||||||||
| - = No Data Reported; -- = Not Applicable; NA = Not Available; W = Withheld to avoid disclosure of individual company data. |
| Release Date: 3/29/2024 |
| Next Release Date: 4/30/2024 |
Referring Pages: