|
Download Data (XLS File) |
|
||||||||
|
||||||||
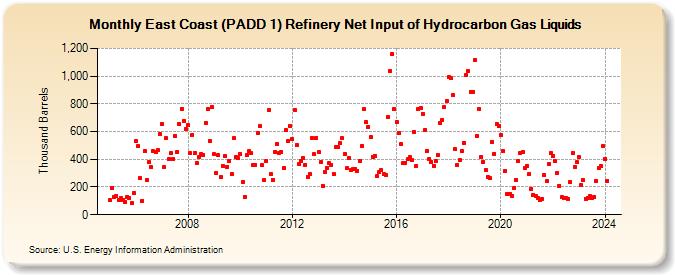
| East Coast (PADD 1) Refinery Net Input of Hydrocarbon Gas Liquids (Thousand Barrels) | ||||||||
| Year | Jan | Feb | Mar | Apr | May | Jun | Jul | Aug | Sep | Oct | Nov | Dec |
|---|---|---|---|---|---|---|---|---|---|---|---|---|
| 2005 | 104 | 193 | 128 | 137 | 108 | 123 | 109 | 92 | 130 | 121 | 83 | 157 |
| 2006 | 530 | 495 | 263 | 101 | 457 | 249 | 381 | 344 | 457 | 453 | 464 | 582 |
| 2007 | 656 | 341 | 550 | 401 | 442 | 404 | 570 | 453 | 653 | 766 | 678 | 620 |
| 2008 | 648 | 442 | 577 | 448 | 374 | 417 | 438 | 433 | 665 | 763 | 531 | 775 |
| 2009 | 436 | 298 | 429 | 272 | 355 | 423 | 347 | 391 | 292 | 550 | 415 | 406 |
| 2010 | 438 | 234 | 130 | 430 | 457 | 442 | 359 | 362 | 591 | 638 | 356 | 248 |
| 2011 | 385 | 753 | 292 | 253 | 454 | 513 | 448 | 453 | 338 | 608 | 533 | 637 |
| 2012 | 544 | 757 | 502 | 365 | 389 | 409 | 361 | 274 | 293 | 554 | 435 | 557 |
| 2013 | 452 | 380 | 209 | 311 | 338 | 371 | 357 | 293 | 485 | 486 | 516 | 550 |
| 2014 | 437 | 335 | 411 | 326 | 330 | 330 | 317 | 391 | 498 | 762 | 667 | 634 |
| 2015 | 560 | 418 | 424 | 276 | 308 | 321 | 292 | 286 | 706 | 1,036 | 1,159 | 761 |
| 2016 | 670 | 591 | 508 | 370 | 376 | 400 | 416 | 395 | 598 | 353 | 762 | 771 |
| 2017 | 729 | 612 | 463 | 404 | 382 | 353 | 389 | 431 | 659 | 686 | 777 | 820 |
| 2018 | 992 | 983 | 861 | 473 | 360 | 393 | 458 | 521 | 1,009 | 1,034 | 886 | 888 |
| 2019 | 1,115 | 570 | 761 | 417 | 383 | 324 | 273 | 263 | 526 | 441 | 654 | 639 |
| 2020 | 576 | 458 | 318 | 148 | 152 | 138 | 191 | 251 | 385 | 447 | 454 | 334 |
| 2021 | 352 | 294 | 189 | 145 | 134 | 122 | 108 | 116 | 286 | 240 | 365 | 445 |
| 2022 | 427 | 385 | 301 | 209 | 125 | 120 | 119 | 116 | 235 | 446 | 347 | 378 |
| 2023 | 413 | 214 | 248 | 116 | 124 | 132 | 121 | 127 | 244 | 336 | 349 | 493 |
| 2024 | 403 | |||||||||||
| - = No Data Reported; -- = Not Applicable; NA = Not Available; W = Withheld to avoid disclosure of individual company data. |
| Release Date: 3/29/2024 |
| Next Release Date: 4/30/2024 |
Referring Pages: