|
Download Data (XLS File) |
|
||||||||
|
||||||||
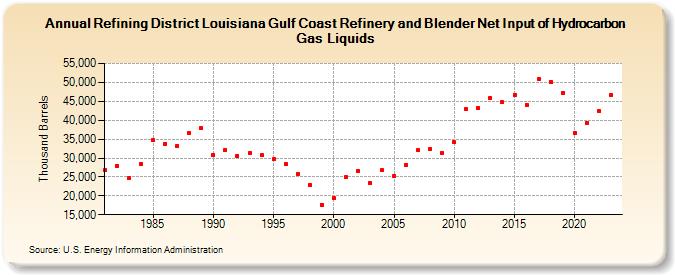
| Refining District Louisiana Gulf Coast Refinery and Blender Net Input of Hydrocarbon Gas Liquids (Thousand Barrels) | ||||||||
| Decade | Year-0 | Year-1 | Year-2 | Year-3 | Year-4 | Year-5 | Year-6 | Year-7 | Year-8 | Year-9 |
|---|---|---|---|---|---|---|---|---|---|---|
| 1980's | 26,775 | 27,836 | 24,772 | 28,487 | 34,756 | 33,772 | 33,235 | 36,491 | 37,896 | |
| 1990's | 30,835 | 32,054 | 30,475 | 31,239 | 30,663 | 29,663 | 28,378 | 25,892 | 22,951 | 17,692 |
| 2000's | 19,445 | 24,859 | 26,624 | 23,508 | 26,715 | 25,176 | 28,199 | 31,986 | 32,355 | 31,367 |
| 2010's | 34,147 | 42,872 | 43,221 | 45,921 | 44,688 | 46,781 | 44,073 | 50,810 | 50,229 | 47,308 |
| 2020's | 36,632 | 39,377 | 42,408 | 46,767 |
| - = No Data Reported; -- = Not Applicable; NA = Not Available; W = Withheld to avoid disclosure of individual company data. |
| Release Date: 3/29/2024 |
| Next Release Date: 8/30/2024 |