|
Download Data (XLS File) |
|
||||||||
|
||||||||
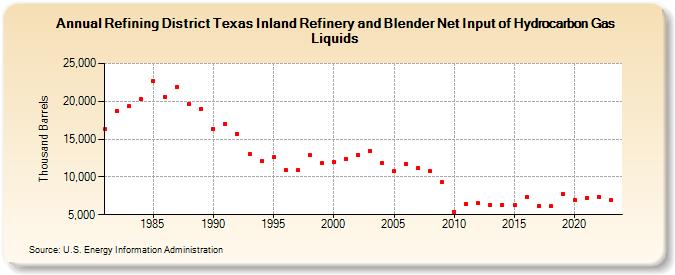
| Refining District Texas Inland Refinery and Blender Net Input of Hydrocarbon Gas Liquids (Thousand Barrels) | ||||||||
| Decade | Year-0 | Year-1 | Year-2 | Year-3 | Year-4 | Year-5 | Year-6 | Year-7 | Year-8 | Year-9 |
|---|---|---|---|---|---|---|---|---|---|---|
| 1980's | 16,288 | 18,775 | 19,342 | 20,260 | 22,654 | 20,619 | 21,901 | 19,621 | 19,005 | |
| 1990's | 16,391 | 17,046 | 15,654 | 13,041 | 12,106 | 12,578 | 10,939 | 10,891 | 12,846 | 11,809 |
| 2000's | 11,989 | 12,404 | 12,938 | 13,479 | 11,860 | 10,732 | 11,738 | 11,204 | 10,776 | 9,300 |
| 2010's | 5,389 | 6,412 | 6,525 | 6,318 | 6,314 | 6,235 | 7,331 | 6,215 | 6,094 | 7,754 |
| 2020's | 6,931 | 7,179 | 7,362 | 6,921 |
| - = No Data Reported; -- = Not Applicable; NA = Not Available; W = Withheld to avoid disclosure of individual company data. |
| Release Date: 3/29/2024 |
| Next Release Date: 8/30/2024 |