|
Download Data (XLS File) |
|
||||||||
|
||||||||
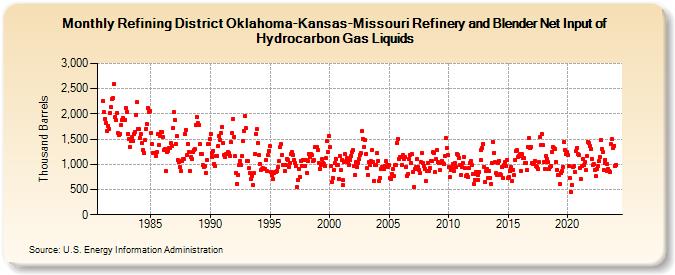
| Refining District Oklahoma-Kansas-Missouri Refinery and Blender Net Input of Hydrocarbon Gas Liquids (Thousand Barrels) | ||||||||
| Year | Jan | Feb | Mar | Apr | May | Jun | Jul | Aug | Sep | Oct | Nov | Dec |
|---|---|---|---|---|---|---|---|---|---|---|---|---|
| 1981 | 2,258 | 2,030 | 1,904 | 1,820 | 1,658 | 1,769 | 1,702 | 2,023 | 2,132 | 2,295 | 2,309 | 2,589 |
| 1982 | 1,938 | 1,873 | 2,016 | 1,614 | 1,586 | 1,597 | 1,786 | 1,879 | 1,917 | 1,872 | 1,887 | 2,113 |
| 1983 | 2,044 | 1,603 | 1,503 | 1,352 | 1,470 | 1,551 | 1,466 | 1,595 | 1,649 | 1,987 | 2,228 | 1,708 |
| 1984 | 1,692 | 1,514 | 1,604 | 1,426 | 1,287 | 1,230 | 1,477 | 1,709 | 1,798 | 2,122 | 2,040 | 2,063 |
| 1985 | 1,626 | 1,412 | 1,229 | 1,222 | 1,217 | 1,160 | 1,235 | 1,592 | 1,386 | 1,557 | 1,642 | 1,643 |
| 1986 | 1,540 | 1,274 | 1,299 | 865 | 1,243 | 1,270 | 1,328 | 1,332 | 1,417 | 1,357 | 1,718 | 2,033 |
| 1987 | 1,886 | 1,411 | 1,552 | 1,085 | 1,051 | 944 | 860 | 1,071 | 1,096 | 1,109 | 1,609 | 1,682 |
| 1988 | 1,178 | 1,409 | 1,253 | 874 | 1,143 | 1,109 | 1,242 | 1,287 | 1,296 | 1,776 | 1,935 | 1,813 |
| 1989 | 1,781 | 1,402 | 1,211 | 1,201 | 977 | 947 | 957 | 836 | 1,084 | 1,393 | 1,403 | 1,493 |
| 1990 | 1,604 | 1,215 | 1,136 | 1,273 | 1,007 | 960 | 1,161 | 1,163 | 1,361 | 1,568 | 1,481 | 1,624 |
| 1991 | 1,743 | 1,426 | 1,183 | 1,142 | 1,195 | 1,203 | 1,237 | 1,216 | 1,170 | 1,434 | 1,620 | 1,905 |
| 1992 | 1,551 | 1,159 | 829 | 616 | 796 | 993 | 1,071 | 994 | 1,167 | 1,472 | 1,670 | 1,958 |
| 1993 | 1,714 | 1,068 | 1,056 | 918 | 836 | 701 | 776 | 591 | 826 | 1,210 | 1,610 | 1,691 |
| 1994 | 1,425 | 1,178 | 1,003 | 892 | 909 | 921 | 905 | 914 | 1,091 | 862 | 1,189 | 1,271 |
| 1995 | 1,357 | 857 | 785 | 708 | 827 | 843 | 856 | 872 | 939 | 1,058 | 1,341 | 1,394 |
| 1996 | 1,185 | 984 | 983 | 874 | 984 | 1,113 | 1,078 | 946 | 1,031 | 1,204 | 1,236 | 1,190 |
| 1997 | 1,095 | 1,022 | 967 | 548 | 684 | 900 | 758 | 1,072 | 971 | 1,090 | 1,088 | 974 |
| 1998 | 1,076 | 833 | 1,061 | 1,209 | 1,142 | 1,204 | 1,179 | 1,056 | 1,081 | 1,343 | 1,343 | 1,350 |
| 1999 | 1,287 | 1,021 | 911 | 981 | 1,098 | 1,017 | 1,008 | 963 | 1,120 | 1,463 | 1,238 | 1,566 |
| 2000 | 1,341 | 973 | 646 | 722 | 884 | 1,017 | 1,111 | 994 | 996 | 712 | 1,169 | 878 |
| 2001 | 1,093 | 586 | 682 | 1,049 | 1,198 | 1,061 | 1,118 | 1,055 | 995 | 1,094 | 1,172 | 1,249 |
| 2002 | 1,275 | 965 | 789 | 1,052 | 948 | 1,035 | 1,100 | 1,192 | 1,219 | 1,654 | 1,510 | 1,348 |
| 2003 | 1,479 | 1,211 | 926 | 783 | 1,047 | 983 | 1,057 | 1,287 | 1,044 | 671 | 988 | 988 |
| 2004 | 1,226 | 1,073 | 672 | 729 | 915 | 951 | 912 | 904 | 976 | 1,058 | 995 | 948 |
| 2005 | 980 | 727 | 700 | 817 | 915 | 772 | 989 | 978 | 1,430 | 1,499 | 1,108 | 1,140 |
| 2006 | 1,143 | 989 | 1,180 | 1,096 | 1,147 | 954 | 775 | 817 | 1,114 | 1,192 | 1,021 | 1,201 |
| 2007 | 844 | 550 | 900 | 955 | 1,096 | 939 | 895 | 837 | 1,042 | 1,225 | 1,025 | 975 |
| 2008 | 911 | 662 | 859 | 1,034 | 859 | 930 | 1,075 | 1,062 | 1,235 | 1,218 | 839 | 1,099 |
| 2009 | 1,283 | 1,042 | 1,023 | 879 | 1,033 | 1,074 | 1,025 | 1,001 | 1,160 | 1,523 | 1,316 | 1,180 |
| 2010 | 947 | 742 | 894 | 930 | 1,008 | 868 | 1,025 | 938 | 1,208 | 1,191 | 1,133 | 981 |
| 2011 | 791 | 954 | 1,027 | 1,146 | 925 | 773 | 789 | 756 | 919 | 1,018 | 1,063 | 992 |
| 2012 | 812 | 609 | 692 | 816 | 847 | 781 | 693 | 852 | 1,076 | 1,286 | 1,321 | 1,408 |
| 2013 | 945 | 653 | 871 | 899 | 727 | 862 | 733 | 613 | 1,032 | 1,444 | 1,230 | 1,037 |
| 2014 | 821 | 787 | 1,029 | 1,071 | 799 | 783 | 946 | 723 | 986 | 1,053 | 957 | 1,082 |
| 2015 | 721 | 757 | 861 | 945 | 659 | 895 | 788 | 1,077 | 1,273 | 1,275 | 1,140 | 1,166 |
| 2016 | 1,195 | 870 | 1,198 | 1,129 | 1,118 | 1,025 | 1,031 | 895 | 1,337 | 1,518 | 1,317 | 1,345 |
| 2017 | 1,029 | 1,013 | 1,001 | 1,073 | 965 | 950 | 909 | 1,039 | 1,540 | 1,376 | 1,602 | 1,377 |
| 2018 | 1,055 | 911 | 1,162 | 1,109 | 1,038 | 901 | 956 | 966 | 1,251 | 1,334 | 1,328 | 1,311 |
| 2019 | 1,046 | 895 | 787 | 788 | 610 | 830 | 871 | 956 | 1,440 | 1,285 | 1,196 | 1,235 |
| 2020 | 1,184 | 970 | 722 | 449 | 599 | 953 | 957 | 849 | 1,261 | 1,329 | 1,208 | 1,179 |
| 2021 | 934 | 713 | 957 | 1,112 | 981 | 1,048 | 881 | 1,168 | 1,451 | 1,427 | 1,355 | 1,297 |
| 2022 | 1,111 | 983 | 1,006 | 896 | 761 | 916 | 969 | 1,057 | 1,149 | 1,477 | 1,310 | 1,238 |
| 2023 | 888 | 1,017 | 1,094 | 1,003 | 870 | 907 | 874 | 851 | 1,395 | 1,503 | 1,324 | 1,372 |
| 2024 | 970 | |||||||||||
| - = No Data Reported; -- = Not Applicable; NA = Not Available; W = Withheld to avoid disclosure of individual company data. |
| Release Date: 3/29/2024 |
| Next Release Date: 4/30/2024 |