|
Download Data (XLS File) |
|
||||||||
|
||||||||
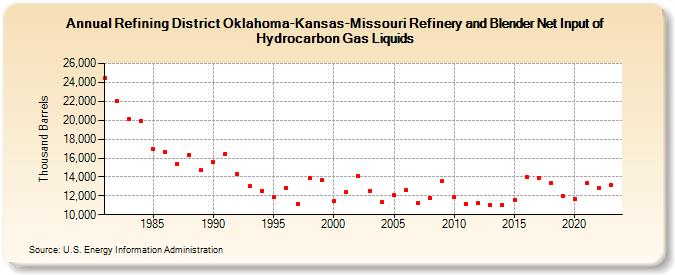
| Refining District Oklahoma-Kansas-Missouri Refinery and Blender Net Input of Hydrocarbon Gas Liquids (Thousand Barrels) | ||||||||
| Decade | Year-0 | Year-1 | Year-2 | Year-3 | Year-4 | Year-5 | Year-6 | Year-7 | Year-8 | Year-9 |
|---|---|---|---|---|---|---|---|---|---|---|
| 1980's | 24,489 | 22,078 | 20,156 | 19,962 | 16,921 | 16,676 | 15,356 | 16,315 | 14,685 | |
| 1990's | 15,553 | 16,474 | 14,276 | 12,997 | 12,560 | 11,837 | 12,808 | 11,169 | 13,877 | 13,673 |
| 2000's | 11,443 | 12,352 | 14,087 | 12,464 | 11,359 | 12,055 | 12,629 | 11,283 | 11,783 | 13,539 |
| 2010's | 11,865 | 11,153 | 11,193 | 11,046 | 11,037 | 11,557 | 13,978 | 13,874 | 13,322 | 11,939 |
| 2020's | 11,660 | 13,324 | 12,873 | 13,098 |
| - = No Data Reported; -- = Not Applicable; NA = Not Available; W = Withheld to avoid disclosure of individual company data. |
| Release Date: 3/29/2024 |
| Next Release Date: 8/30/2024 |