|
Download Data (XLS File) |
|
||||||||
|
||||||||
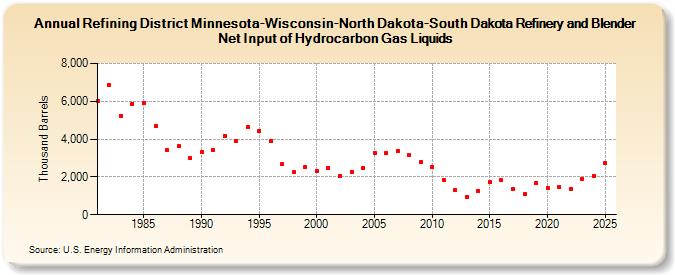
| Refining District Minnesota-Wisconsin-North Dakota-South Dakota Refinery and Blender Net Input of Hydrocarbon Gas Liquids (Thousand Barrels) | ||||||||
| Decade | Year-0 | Year-1 | Year-2 | Year-3 | Year-4 | Year-5 | Year-6 | Year-7 | Year-8 | Year-9 |
|---|---|---|---|---|---|---|---|---|---|---|
| 1980's | 6,040 | 6,843 | 5,247 | 5,883 | 5,934 | 4,688 | 3,397 | 3,624 | 3,005 | |
| 1990's | 3,301 | 3,439 | 4,179 | 3,887 | 4,618 | 4,447 | 3,903 | 2,669 | 2,235 | 2,515 |
| 2000's | 2,286 | 2,470 | 2,054 | 2,251 | 2,489 | 3,273 | 3,273 | 3,370 | 3,133 | 2,783 |
| 2010's | 2,550 | 1,840 | 1,308 | 958 | 1,259 | 1,733 | 1,848 | 1,349 | 1,076 | 1,665 |
| 2020's | 1,398 | 1,460 | 1,343 | 1,914 |
| - = No Data Reported; -- = Not Applicable; NA = Not Available; W = Withheld to avoid disclosure of individual company data. |
| Release Date: 3/29/2024 |
| Next Release Date: 8/30/2024 |