|
Download Data (XLS File) |
|
||||||||
|
||||||||
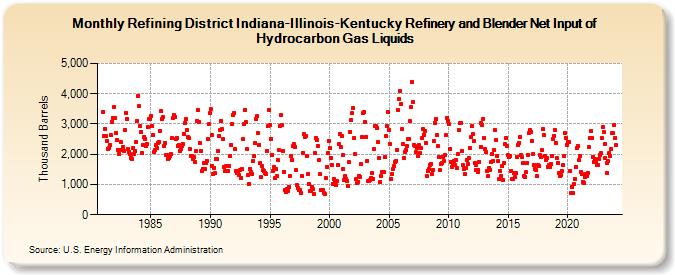
| Refining District Indiana-Illinois-Kentucky Refinery and Blender Net Input of Hydrocarbon Gas Liquids (Thousand Barrels) | ||||||||
| Year | Jan | Feb | Mar | Apr | May | Jun | Jul | Aug | Sep | Oct | Nov | Dec |
|---|---|---|---|---|---|---|---|---|---|---|---|---|
| 1981 | 3,411 | 2,593 | 2,850 | 2,597 | 2,431 | 2,189 | 2,203 | 2,307 | 2,619 | 3,074 | 3,211 | 3,566 |
| 1982 | 3,205 | 2,716 | 2,479 | 2,141 | 2,000 | 2,154 | 2,391 | 2,142 | 2,250 | 2,108 | 2,813 | 3,376 |
| 1983 | 3,170 | 2,170 | 2,086 | 2,010 | 1,885 | 1,828 | 2,201 | 2,012 | 2,113 | 2,410 | 3,099 | 3,939 |
| 1984 | 3,581 | 2,940 | 2,730 | 2,039 | 2,315 | 2,577 | 2,507 | 2,272 | 2,336 | 2,896 | 3,156 | 3,162 |
| 1985 | 3,256 | 2,925 | 2,630 | 2,084 | 2,129 | 2,302 | 2,196 | 2,368 | 2,412 | 2,773 | 3,413 | 3,157 |
| 1986 | 3,237 | 2,260 | 2,376 | 1,967 | 1,982 | 1,845 | 1,874 | 1,943 | 2,021 | 2,531 | 3,193 | 3,299 |
| 1987 | 3,236 | 2,500 | 2,551 | 2,274 | 2,318 | 2,095 | 2,169 | 2,272 | 2,349 | 2,677 | 3,016 | 3,161 |
| 1988 | 2,795 | 2,565 | 2,540 | 2,165 | 1,950 | 1,945 | 1,856 | 1,910 | 1,748 | 2,105 | 3,091 | 3,467 |
| 1989 | 3,074 | 2,381 | 2,122 | 1,431 | 1,496 | 1,700 | 1,523 | 1,725 | 1,781 | 2,500 | 2,983 | 3,354 |
| 1990 | 3,491 | 2,626 | 1,602 | 1,337 | 1,557 | 1,366 | 1,828 | 1,837 | 2,108 | 2,600 | 2,788 | 3,086 |
| 1991 | 2,833 | 2,492 | 1,565 | 1,452 | 1,600 | 1,436 | 1,458 | 1,621 | 1,931 | 2,311 | 2,993 | 3,311 |
| 1992 | 3,366 | 2,158 | 1,455 | 1,369 | 1,413 | 1,301 | 1,466 | 1,221 | 1,509 | 2,490 | 3,000 | 3,462 |
| 1993 | 3,065 | 2,164 | 1,308 | 1,031 | 1,516 | 1,426 | 1,346 | 1,782 | 1,929 | 2,371 | 3,160 | 3,253 |
| 1994 | 2,687 | 2,307 | 1,697 | 1,231 | 1,623 | 1,464 | 1,456 | 1,393 | 1,353 | 2,119 | 2,919 | 3,454 |
| 1995 | 2,969 | 2,516 | 1,988 | 1,457 | 1,582 | 1,205 | 1,516 | 1,279 | 1,818 | 2,133 | 2,941 | 3,287 |
| 1996 | 2,950 | 2,120 | 1,424 | 810 | 741 | 861 | 794 | 930 | 1,264 | 1,949 | 1,814 | 2,259 |
| 1997 | 2,327 | 2,237 | 1,468 | 996 | 897 | 817 | 807 | 734 | 1,283 | 2,052 | 2,664 | 2,564 |
| 1998 | 2,613 | 1,949 | 1,337 | 1,008 | 791 | 780 | 927 | 858 | 696 | 2,039 | 2,543 | 2,466 |
| 1999 | 2,286 | 1,796 | 1,343 | 832 | 803 | 814 | 731 | 676 | 1,203 | 1,588 | 2,041 | 2,448 |
| 2000 | 2,203 | 1,888 | 1,640 | 1,032 | 1,191 | 1,065 | 982 | 1,116 | 1,645 | 2,339 | 2,666 | 2,245 |
| 2001 | 2,601 | 1,968 | 1,505 | 1,145 | 1,282 | 1,173 | 1,121 | 934 | 1,728 | 2,751 | 3,127 | 3,352 |
| 2002 | 3,530 | 2,538 | 1,992 | 1,173 | 1,063 | 1,092 | 1,295 | 1,257 | 1,668 | 2,556 | 3,368 | 3,401 |
| 2003 | 3,068 | 2,571 | 1,780 | 1,100 | 1,127 | 1,148 | 1,222 | 1,374 | 1,189 | 2,172 | 2,943 | 2,924 |
| 2004 | 2,860 | 2,397 | 1,867 | 1,092 | 1,286 | 1,420 | 1,425 | 1,419 | 1,905 | 2,601 | 2,924 | 3,384 |
| 2005 | 2,816 | 2,338 | 1,196 | 1,348 | 1,501 | 1,616 | 1,742 | 1,783 | 2,134 | 3,447 | 3,813 | 4,079 |
| 2006 | 3,667 | 2,826 | 2,324 | 1,880 | 2,075 | 2,137 | 2,275 | 2,489 | 2,502 | 3,087 | 3,569 | 4,388 |
| 2007 | 3,718 | 2,314 | 2,271 | 2,060 | 2,217 | 1,931 | 2,294 | 2,034 | 2,209 | 2,526 | 2,819 | 2,646 |
| 2008 | 2,774 | 2,375 | 1,280 | 1,451 | 1,495 | 1,637 | 1,677 | 1,333 | 1,479 | 2,432 | 3,028 | 3,167 |
| 2009 | 2,625 | 2,262 | 1,905 | 1,467 | 1,662 | 1,721 | 1,919 | 1,766 | 1,961 | 2,627 | 3,194 | 3,102 |
| 2010 | 3,007 | 2,169 | 1,732 | 1,588 | 1,693 | 1,774 | 1,646 | 1,824 | 1,544 | 2,014 | 2,800 | 3,017 |
| 2011 | 3,041 | 2,110 | 1,633 | 1,512 | 1,335 | 1,531 | 1,800 | 1,678 | 1,872 | 2,212 | 2,554 | 2,921 |
| 2012 | 2,654 | 2,432 | 1,715 | 1,635 | 1,469 | 1,405 | 1,488 | 1,756 | 2,247 | 3,022 | 2,976 | 3,176 |
| 2013 | 2,535 | 2,157 | 2,071 | 1,430 | 1,266 | 1,559 | 1,489 | 1,736 | 2,014 | 1,771 | 2,133 | 2,794 |
| 2014 | 2,472 | 1,957 | 1,771 | 1,181 | 1,442 | 1,292 | 1,599 | 1,145 | 1,722 | 2,328 | 2,545 | 2,288 |
| 2015 | 1,969 | 1,896 | 1,954 | 1,448 | 1,177 | 1,191 | 1,364 | 1,253 | 1,366 | 1,911 | 2,311 | 2,375 |
| 2016 | 2,585 | 1,971 | 1,897 | 1,725 | 1,284 | 1,247 | 1,410 | 1,702 | 1,959 | 2,695 | 2,790 | 2,747 |
| 2017 | 2,447 | 2,023 | 1,631 | 1,521 | 1,479 | 1,270 | 1,644 | 1,622 | 1,970 | 1,916 | 2,143 | 2,830 |
| 2018 | 2,635 | 1,935 | 1,800 | 1,859 | 1,586 | 1,654 | 1,567 | 1,688 | 1,933 | 2,507 | 2,615 | 2,809 |
| 2019 | 2,376 | 1,864 | 1,722 | 1,391 | 1,290 | 1,297 | 1,452 | 1,634 | 1,952 | 2,687 | 2,538 | 2,317 |
| 2020 | 2,397 | 2,390 | 1,443 | 703 | 911 | 729 | 1,029 | 1,197 | 1,570 | 2,191 | 2,278 | 1,800 |
| 2021 | 1,934 | 1,421 | 1,331 | 1,098 | 1,053 | 1,260 | 1,349 | 1,267 | 1,384 | 2,239 | 2,524 | 2,774 |
| 2022 | 2,524 | 1,920 | 1,743 | 1,831 | 1,749 | 1,647 | 1,656 | 1,826 | 1,975 | 2,029 | 2,540 | 2,912 |
| 2023 | 2,730 | 2,348 | 1,859 | 1,381 | 1,707 | 1,761 | 2,048 | 1,947 | 2,180 | 2,700 | 2,692 | 2,960 |
| 2024 | 2,541 | |||||||||||
| - = No Data Reported; -- = Not Applicable; NA = Not Available; W = Withheld to avoid disclosure of individual company data. |
| Release Date: 3/29/2024 |
| Next Release Date: 4/30/2024 |