|
Download Data (XLS File) |
|
||||||||
|
||||||||
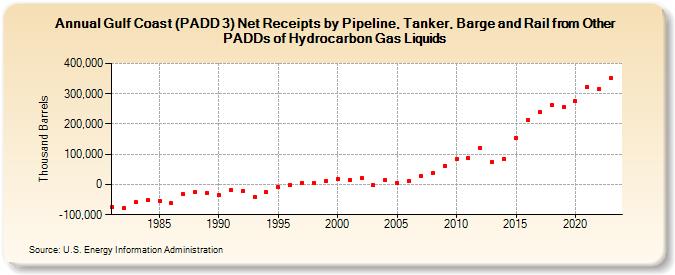
| Gulf Coast (PADD 3) Net Receipts by Pipeline, Tanker, Barge and Rail from Other PADDs of Hydrocarbon Gas Liquids (Thousand Barrels) | ||||||||
| Decade | Year-0 | Year-1 | Year-2 | Year-3 | Year-4 | Year-5 | Year-6 | Year-7 | Year-8 | Year-9 |
|---|---|---|---|---|---|---|---|---|---|---|
| 1980's | -75,578 | -78,775 | -58,166 | -51,878 | -54,659 | -61,310 | -32,128 | -25,555 | -28,139 | |
| 1990's | -34,951 | -16,858 | -22,158 | -41,851 | -25,600 | -9,596 | -1,969 | 4,999 | 6,073 | 11,024 |
| 2000's | 17,394 | 15,320 | 21,289 | -2,692 | 13,269 | 3,652 | 9,851 | 27,494 | 36,514 | 60,448 |
| 2010's | 84,275 | 87,826 | 121,529 | 73,461 | 83,698 | 155,224 | 212,069 | 239,403 | 261,183 | 256,362 |
| 2020's | 274,915 | 321,941 | 316,926 | 350,826 |
| - = No Data Reported; -- = Not Applicable; NA = Not Available; W = Withheld to avoid disclosure of individual company data. |
| Release Date: 4/30/2024 |
| Next Release Date: 8/30/2024 |