|
Download Data (XLS File) |
|
||||||||
|
||||||||
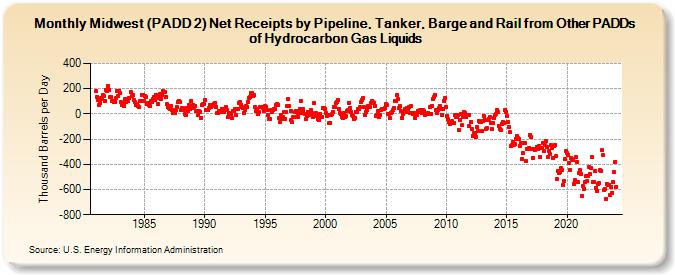
| Midwest (PADD 2) Net Receipts by Pipeline, Tanker, Barge and Rail from Other PADDs of Hydrocarbon Gas Liquids (Thousand Barrels per Day) | ||||||||
| Year | Jan | Feb | Mar | Apr | May | Jun | Jul | Aug | Sep | Oct | Nov | Dec |
|---|---|---|---|---|---|---|---|---|---|---|---|---|
| 1981 | 181 | 137 | 108 | 68 | 88 | 130 | 118 | 147 | 139 | 102 | 187 | 178 |
| 1982 | 223 | 193 | 136 | 137 | 103 | 102 | 95 | 94 | 126 | 180 | 141 | 184 |
| 1983 | 163 | 92 | 68 | 84 | 65 | 119 | 97 | 108 | 102 | 128 | 172 | 142 |
| 1984 | 151 | 111 | 97 | 72 | 75 | 61 | 53 | 102 | 106 | 151 | 149 | 106 |
| 1985 | 143 | 134 | 76 | 86 | 73 | 62 | 103 | 95 | 119 | 133 | 109 | 152 |
| 1986 | 145 | 78 | 127 | 154 | 115 | 149 | 185 | 176 | 177 | 138 | 76 | 57 |
| 1987 | 50 | 40 | 64 | 27 | 10 | 14 | 4 | 29 | 58 | 95 | 103 | 94 |
| 1988 | 30 | 45 | 47 | 30 | -2 | -11 | 48 | 21 | 70 | 40 | 102 | 49 |
| 1989 | 69 | 54 | 62 | 22 | 25 | -10 | 22 | 17 | -30 | 69 | 77 | 82 |
| 1990 | 110 | 27 | 29 | 33 | 49 | 71 | 58 | 59 | 68 | 81 | 87 | 56 |
| 1991 | 8 | 11 | 22 | 14 | 26 | 42 | 30 | 14 | 37 | 56 | 29 | -28 |
| 1992 | 7 | -2 | -1 | -36 | 21 | 19 | 39 | -11 | 40 | 41 | 87 | 91 |
| 1993 | 71 | 51 | 49 | 7 | 33 | 66 | 56 | 92 | 130 | 134 | 163 | 165 |
| 1994 | 144 | 148 | 52 | 22 | 38 | 0 | 18 | 51 | 55 | 57 | 46 | 22 |
| 1995 | 63 | 55 | 29 | -6 | -37 | -40 | 27 | 13 | 30 | 42 | 35 | 70 |
| 1996 | 81 | 73 | -32 | -67 | -5 | -40 | -27 | 17 | -37 | 15 | 64 | 118 |
| 1997 | 61 | 24 | -52 | -67 | -23 | -21 | 16 | 19 | -21 | 6 | 38 | 101 |
| 1998 | 9 | 23 | 35 | -1 | -41 | -16 | 17 | -9 | 18 | 32 | 10 | -21 |
| 1999 | 86 | -16 | 6 | -15 | -40 | -48 | -1 | -23 | -28 | 45 | 48 | 40 |
| 2000 | 7 | -15 | -9 | -76 | -69 | -9 | -1 | 17 | 53 | 56 | 90 | 94 |
| 2001 | 110 | 41 | 10 | -3 | -24 | -29 | 11 | -23 | -13 | 23 | 29 | 85 |
| 2002 | 50 | 18 | -12 | -13 | -40 | -29 | 18 | 18 | 40 | 39 | 51 | 93 |
| 2003 | 109 | 125 | 52 | -6 | 18 | 29 | 62 | 53 | 53 | 90 | 102 | 93 |
| 2004 | 90 | 59 | -17 | -7 | 25 | -22 | -7 | 28 | 40 | 39 | 36 | 45 |
| 2005 | 78 | 68 | 3 | 0 | -32 | 8 | 12 | 28 | 47 | 106 | 101 | 149 |
| 2006 | 121 | 43 | 62 | 22 | -30 | 3 | 15 | 35 | 18 | 49 | 40 | 57 |
| 2007 | 8 | 59 | 4 | -1 | 10 | -31 | 1 | -12 | 20 | 14 | 27 | 34 |
| 2008 | 6 | 31 | 20 | -7 | 2 | 1 | 8 | 2 | 58 | 2 | 61 | 120 |
| 2009 | 138 | 150 | 28 | 8 | 31 | 48 | 61 | 37 | -10 | 42 | 103 | 125 |
| 2010 | 58 | -15 | -43 | -62 | -79 | -74 | -60 | -70 | -74 | -9 | -25 | -26 |
| 2011 | -12 | -131 | -49 | -1 | -91 | -21 | 16 | 4 | -24 | -5 | -7 | -97 |
| 2012 | -61 | -122 | -175 | -152 | -151 | -180 | -103 | -136 | -57 | -66 | -67 | -139 |
| 2013 | -53 | -16 | -45 | -122 | -114 | -48 | -44 | -25 | -76 | -117 | -69 | -36 |
| 2014 | -12 | -2 | 29 | 18 | -94 | -118 | -130 | -78 | -64 | -69 | 29 | 15 |
| 2015 | -20 | -67 | -107 | -146 | -257 | -250 | -223 | -249 | -240 | -198 | -173 | -192 |
| 2016 | -203 | -253 | -228 | -360 | -311 | -231 | -231 | -373 | -275 | -280 | -270 | -168 |
| 2017 | -184 | -276 | -349 | -278 | -288 | -279 | -260 | -281 | -255 | -341 | -273 | -273 |
| 2018 | -233 | -293 | -247 | -214 | -263 | -343 | -298 | -321 | -250 | -271 | -348 | -255 |
| 2019 | -245 | -336 | -513 | -451 | -471 | -462 | -431 | -447 | -566 | -533 | -359 | -296 |
| 2020 | -310 | -323 | -386 | -446 | -353 | -355 | -367 | -554 | -527 | -340 | -379 | -540 |
| 2021 | -467 | -448 | -478 | -651 | -576 | -595 | -540 | -495 | -536 | -495 | -421 | -478 |
| 2022 | -432 | -341 | -538 | -539 | -452 | -587 | -611 | -554 | -551 | -449 | -450 | -290 |
| 2023 | -330 | -603 | -599 | -676 | -555 | -565 | -562 | -646 | -580 | -625 | -541 | -465 |
| 2024 | -379 | |||||||||||
| - = No Data Reported; -- = Not Applicable; NA = Not Available; W = Withheld to avoid disclosure of individual company data. |
| Release Date: 3/29/2024 |
| Next Release Date: 4/30/2024 |