|
Download Data (XLS File) |
|
||||||||
|
||||||||
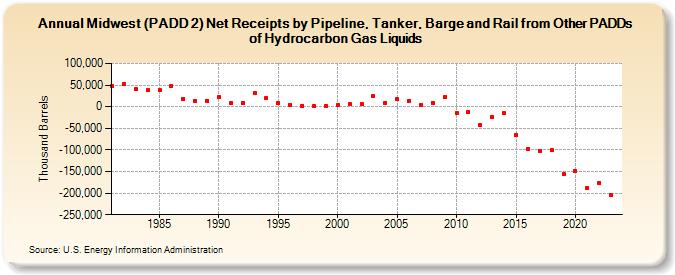
| Midwest (PADD 2) Net Receipts by Pipeline, Tanker, Barge and Rail from Other PADDs of Hydrocarbon Gas Liquids (Thousand Barrels) | ||||||||
| Decade | Year-0 | Year-1 | Year-2 | Year-3 | Year-4 | Year-5 | Year-6 | Year-7 | Year-8 | Year-9 |
|---|---|---|---|---|---|---|---|---|---|---|
| 1980's | 48,124 | 52,010 | 40,784 | 37,647 | 39,057 | 48,107 | 17,950 | 14,302 | 14,029 | |
| 1990's | 22,227 | 7,980 | 9,038 | 30,929 | 19,677 | 8,558 | 4,908 | 2,524 | 1,670 | 1,782 |
| 2000's | 4,185 | 6,677 | 7,116 | 23,596 | 9,440 | 17,222 | 13,299 | 3,969 | 9,291 | 22,966 |
| 2010's | -14,557 | -12,536 | -42,996 | -23,445 | -14,628 | -64,747 | -97,030 | -101,504 | -101,350 | -155,561 |
| 2020's | -148,944 | -188,050 | -176,496 | -204,980 |
| - = No Data Reported; -- = Not Applicable; NA = Not Available; W = Withheld to avoid disclosure of individual company data. |
| Release Date: 4/30/2024 |
| Next Release Date: 8/30/2024 |