|
Download Data (XLS File) |
|
||||||||
|
||||||||
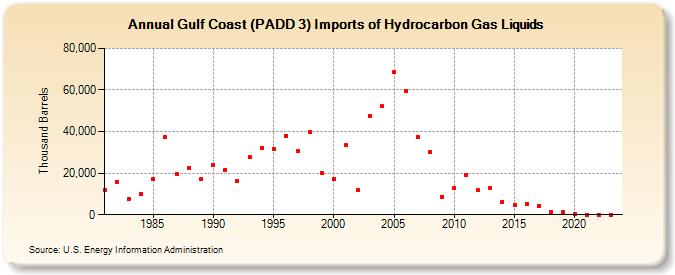
| Gulf Coast (PADD 3) Imports of Hydrocarbon Gas Liquids (Thousand Barrels) | ||||||||
| Decade | Year-0 | Year-1 | Year-2 | Year-3 | Year-4 | Year-5 | Year-6 | Year-7 | Year-8 | Year-9 |
|---|---|---|---|---|---|---|---|---|---|---|
| 1980's | 11,907 | 15,931 | 7,643 | 10,084 | 17,218 | 37,319 | 19,628 | 22,408 | 16,983 | |
| 1990's | 23,827 | 21,637 | 16,217 | 27,619 | 32,268 | 31,819 | 38,088 | 30,495 | 39,751 | 20,042 |
| 2000's | 17,150 | 33,303 | 11,936 | 47,479 | 52,123 | 68,848 | 59,580 | 37,362 | 30,072 | 8,581 |
| 2010's | 12,643 | 19,287 | 11,694 | 12,631 | 6,260 | 4,588 | 5,022 | 4,286 | 1,529 | 1,250 |
| 2020's | 160 | 54 | 99 | 9 |
| - = No Data Reported; -- = Not Applicable; NA = Not Available; W = Withheld to avoid disclosure of individual company data. |
| Release Date: 4/30/2024 |
| Next Release Date: 8/30/2024 |