|
Download Data (XLS File) |
|
||||||||
|
||||||||
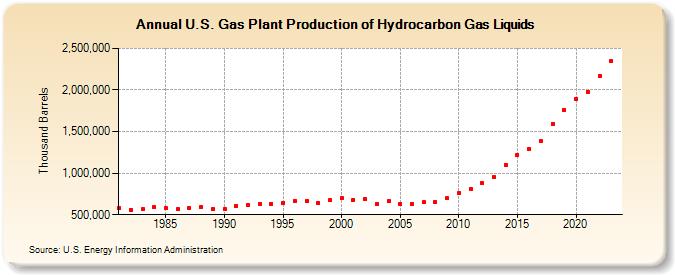
| U.S. Gas Plant Production of Hydrocarbon Gas Liquids (Thousand Barrels) | ||||||||
| Decade | Year-0 | Year-1 | Year-2 | Year-3 | Year-4 | Year-5 | Year-6 | Year-7 | Year-8 | Year-9 |
|---|---|---|---|---|---|---|---|---|---|---|
| 1980's | 580,529 | 561,908 | 564,699 | 595,152 | 582,206 | 564,401 | 580,714 | 593,283 | 564,125 | |
| 1990's | 568,999 | 605,658 | 621,178 | 633,518 | 630,200 | 643,199 | 669,820 | 663,266 | 642,202 | 675,120 |
| 2000's | 699,415 | 681,964 | 686,288 | 627,510 | 662,151 | 626,703 | 634,654 | 650,794 | 652,822 | 697,124 |
| 2010's | 757,019 | 808,865 | 881,306 | 951,057 | 1,100,298 | 1,219,949 | 1,284,357 | 1,380,702 | 1,594,813 | 1,760,945 |
| 2020's | 1,893,894 | 1,980,085 | 2,165,567 | 2,347,283 |
| - = No Data Reported; -- = Not Applicable; NA = Not Available; W = Withheld to avoid disclosure of individual company data. |
| Release Date: 3/29/2024 |
| Next Release Date: 8/30/2024 |