|
Download Data (XLS File) |
|
||||||||
|
||||||||
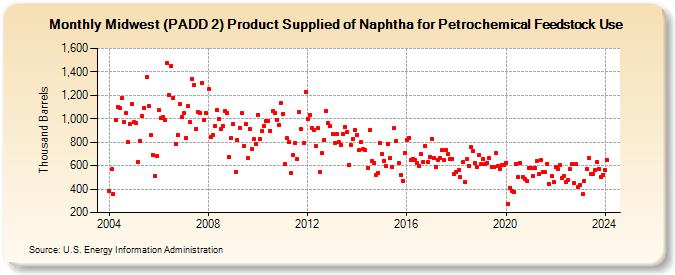
| Midwest (PADD 2) Product Supplied of Naphtha for Petrochemical Feedstock Use (Thousand Barrels) | ||||||||
| Year | Jan | Feb | Mar | Apr | May | Jun | Jul | Aug | Sep | Oct | Nov | Dec |
|---|---|---|---|---|---|---|---|---|---|---|---|---|
| 2004 | 382 | 568 | 359 | 990 | 1,096 | 1,091 | 1,177 | 969 | 1,046 | 800 | 955 | 1,127 |
| 2005 | 970 | 960 | 633 | 810 | 1,023 | 1,094 | 1,359 | 1,109 | 865 | 693 | 516 | 680 |
| 2006 | 1,071 | 1,004 | 1,019 | 988 | 1,473 | 1,201 | 1,453 | 1,181 | 784 | 864 | 1,125 | 1,014 |
| 2007 | 1,049 | 840 | 1,108 | 972 | 1,335 | 1,292 | 915 | 1,056 | 1,048 | 1,307 | 992 | 1,046 |
| 2008 | 1,251 | 846 | 861 | 938 | 1,071 | 1,002 | 910 | 937 | 1,070 | 1,050 | 676 | 837 |
| 2009 | 956 | 548 | 816 | 925 | 1,049 | 765 | 959 | 664 | 913 | 738 | 827 | 786 |
| 2010 | 1,036 | 828 | 892 | 938 | 977 | 983 | 896 | 1,066 | 1,047 | 990 | 944 | 1,135 |
| 2011 | 1,044 | 614 | 833 | 799 | 539 | 693 | 794 | 658 | 1,056 | 909 | 792 | 1,230 |
| 2012 | 1,002 | 1,034 | 925 | 903 | 764 | 922 | 543 | 710 | 818 | 1,068 | 963 | 938 |
| 2013 | 871 | 793 | 869 | 803 | 772 | 866 | 932 | 891 | 609 | 778 | 831 | 903 |
| 2014 | 862 | 731 | 800 | 741 | 736 | 584 | 900 | 640 | 626 | 520 | 537 | 789 |
| 2015 | 703 | 643 | 600 | 783 | 665 | 586 | 923 | 811 | 623 | 523 | 472 | 706 |
| 2016 | 817 | 838 | 648 | 659 | 644 | 622 | 596 | 699 | 634 | 768 | 627 | 674 |
| 2017 | 831 | 665 | 591 | 652 | 666 | 732 | 646 | 736 | 696 | 658 | 661 | 529 |
| 2018 | 546 | 562 | 499 | 629 | 459 | 656 | 595 | 755 | 723 | 622 | 591 | 687 |
| 2019 | 615 | 659 | 610 | 625 | 663 | 585 | 588 | 710 | 594 | 570 | 607 | 602 |
| 2020 | 622 | 277 | 413 | 380 | 375 | 618 | 503 | 620 | 503 | 490 | 465 | 582 |
| 2021 | 577 | 509 | 576 | 643 | 531 | 649 | 550 | 544 | 616 | 444 | 510 | 460 |
| 2022 | 585 | 570 | 603 | 492 | 510 | 458 | 475 | 571 | 618 | 451 | 613 | 422 |
| 2023 | 434 | 355 | 465 | 568 | 662 | 530 | 532 | 562 | 632 | 574 | 505 | 520 |
| 2024 | 563 | |||||||||||
| - = No Data Reported; -- = Not Applicable; NA = Not Available; W = Withheld to avoid disclosure of individual company data. |
| Release Date: 3/29/2024 |
| Next Release Date: 4/30/2024 |