|
Download Data (XLS File) |
|
||||||||
|
||||||||
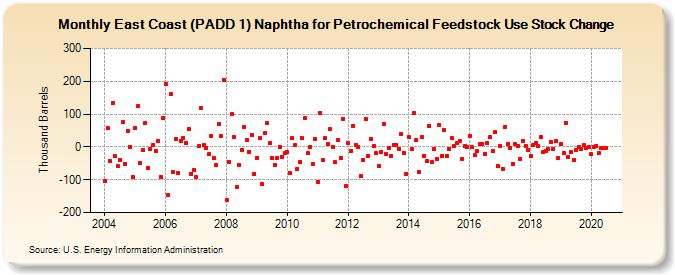
| East Coast (PADD 1) Naphtha for Petrochemical Feedstock Use Stock Change (Thousand Barrels) | ||||||||
| Year | Jan | Feb | Mar | Apr | May | Jun | Jul | Aug | Sep | Oct | Nov | Dec |
|---|---|---|---|---|---|---|---|---|---|---|---|---|
| 2004 | -105 | 57 | -42 | 134 | -28 | -58 | -39 | 75 | -53 | 48 | -1 | -91 |
| 2005 | 57 | 124 | -49 | -9 | 73 | -63 | -6 | 7 | -13 | 19 | -91 | 89 |
| 2006 | 191 | -147 | 160 | -75 | 24 | -79 | 19 | 28 | 12 | 55 | -83 | -71 |
| 2007 | -92 | 2 | 119 | 6 | -2 | -23 | 34 | -33 | -55 | 69 | 32 | 203 |
| 2008 | -161 | -46 | 100 | 30 | -121 | -56 | -9 | 61 | 21 | -15 | 37 | -83 |
| 2009 | -33 | 26 | -114 | 41 | 72 | 12 | -33 | -55 | -34 | 0 | -30 | -20 |
| 2010 | -17 | -78 | 27 | 5 | -68 | -45 | 26 | 89 | -20 | 1 | -53 | 25 |
| 2011 | -106 | 104 | -40 | 27 | 9 | 53 | 1 | -47 | 20 | -33 | 86 | -119 |
| 2012 | 11 | -12 | 64 | 5 | 0 | -88 | -41 | 86 | -27 | 24 | 2 | -19 |
| 2013 | -59 | -15 | 69 | -22 | -3 | -27 | 7 | 7 | -6 | 40 | -19 | -82 |
| 2014 | 29 | -6 | 103 | 22 | -75 | 30 | -28 | -42 | 63 | -47 | -7 | -37 |
| 2015 | 66 | -29 | 50 | -29 | -6 | 26 | 2 | 12 | 18 | -36 | 3 | 0 |
| 2016 | 34 | -1 | -25 | -13 | 8 | 10 | -21 | 12 | 29 | -13 | 46 | -58 |
| 2017 | 3 | -67 | 61 | 9 | -3 | -51 | 10 | 2 | -36 | 18 | 3 | -10 |
| 2018 | -27 | 6 | 12 | 2 | 30 | -16 | -11 | -7 | 15 | -5 | 17 | -34 |
| 2019 | 10 | -18 | 73 | -31 | -17 | -39 | -9 | 0 | -6 | 5 | -3 | 0 |
| 2020 | -23 | 0 | 2 | -20 | -2 | -2 | -2 | |||||
| - = No Data Reported; -- = Not Applicable; NA = Not Available; W = Withheld to avoid disclosure of individual company data. |
| Release Date: 3/29/2024 |
| Next Release Date: 4/30/2024 |