|
Download Data (XLS File) |
|
||||||||
|
||||||||
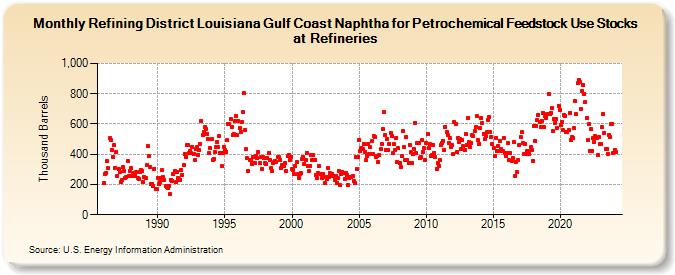
| Refining District Louisiana Gulf Coast Naphtha for Petrochemical Feedstock Use Stocks at Refineries (Thousand Barrels) | ||||||||
| Year | Jan | Feb | Mar | Apr | May | Jun | Jul | Aug | Sep | Oct | Nov | Dec |
|---|---|---|---|---|---|---|---|---|---|---|---|---|
| 1986 | 207 | 268 | 278 | 355 | 307 | 504 | 492 | 429 | 382 | 458 | 311 | 415 |
| 1987 | 256 | 300 | 281 | 215 | 230 | 313 | 287 | 242 | 250 | 356 | 257 | 287 |
| 1988 | 308 | 255 | 264 | 273 | 258 | 282 | 245 | 237 | 281 | 297 | 289 | 216 |
| 1989 | 247 | 242 | 327 | 452 | 385 | 317 | 204 | 202 | 188 | 305 | 167 | 172 |
| 1990 | 243 | 202 | 216 | 241 | 294 | 248 | 230 | 189 | 183 | 175 | 191 | 135 |
| 1991 | 231 | 226 | 266 | 287 | 214 | 281 | 240 | 234 | 228 | 298 | 265 | 328 |
| 1992 | 399 | 381 | 460 | 458 | 405 | 422 | 407 | 449 | 400 | 361 | 434 | 445 |
| 1993 | 395 | 427 | 470 | 619 | 525 | 548 | 583 | 567 | 537 | 498 | 408 | 440 |
| 1994 | 498 | 365 | 369 | 412 | 449 | 481 | 447 | 518 | 409 | 321 | 411 | 450 |
| 1995 | 431 | 417 | 491 | 599 | 599 | 631 | 579 | 529 | 534 | 619 | 654 | 525 |
| 1996 | 622 | 576 | 550 | 613 | 679 | 803 | 559 | 432 | 375 | 288 | 362 | 361 |
| 1997 | 337 | 383 | 345 | 339 | 391 | 375 | 413 | 341 | 380 | 305 | 379 | 375 |
| 1998 | 340 | 335 | 378 | 409 | 365 | 307 | 292 | 341 | 350 | 354 | 349 | 384 |
| 1999 | 380 | 364 | 307 | 330 | 332 | 324 | 344 | 288 | 386 | 394 | 362 | 379 |
| 2000 | 301 | 297 | 268 | 321 | 346 | 266 | 246 | 267 | 273 | 367 | 383 | 335 |
| 2001 | 361 | 411 | 324 | 289 | 325 | 398 | 365 | 392 | 361 | 262 | 245 | 273 |
| 2002 | 323 | 266 | 272 | 246 | 272 | 207 | 252 | 238 | 307 | 247 | 273 | 257 |
| 2003 | 272 | 253 | 232 | 259 | 210 | 242 | 290 | 197 | 272 | 281 | 274 | 237 |
| 2004 | 275 | 261 | 195 | 245 | 248 | 247 | 254 | 223 | 211 | 382 | 299 | 383 |
| 2005 | 494 | 419 | 442 | 437 | 469 | 412 | 360 | 390 | 466 | 404 | 446 | 489 |
| 2006 | 403 | 519 | 517 | 384 | 390 | 347 | 392 | 435 | 470 | 568 | 680 | 524 |
| 2007 | 431 | 501 | 431 | 470 | 543 | 518 | 408 | 467 | 430 | 509 | 351 | 438 |
| 2008 | 343 | 318 | 387 | 554 | 445 | 365 | 513 | 362 | 339 | 462 | 412 | 344 |
| 2009 | 401 | 436 | 609 | 407 | 474 | 476 | 373 | 381 | 492 | 417 | 438 | 364 |
| 2010 | 477 | 533 | 440 | 467 | 390 | 394 | 464 | 410 | 379 | 305 | 339 | 322 |
| 2011 | 363 | 462 | 474 | 488 | 431 | 583 | 544 | 525 | 476 | 504 | 449 | 461 |
| 2012 | 401 | 610 | 602 | 415 | 510 | 483 | 498 | 436 | 495 | 452 | 426 | 533 |
| 2013 | 464 | 640 | 480 | 450 | 474 | 525 | 519 | 554 | 580 | 650 | 493 | 470 |
| 2014 | 575 | 640 | 605 | 537 | 500 | 518 | 545 | 625 | 643 | 549 | 513 | 466 |
| 2015 | 438 | 385 | 510 | 418 | 455 | 421 | 488 | 434 | 418 | 510 | 409 | 387 |
| 2016 | 408 | 473 | 360 | 406 | 356 | 377 | 482 | 256 | 350 | 281 | 360 | 460 |
| 2017 | 515 | 544 | 475 | 401 | 470 | 402 | 422 | 421 | 402 | 445 | 427 | 358 |
| 2018 | 586 | 490 | 586 | 624 | 661 | 611 | 577 | 620 | 674 | 578 | 652 | 640 |
| 2019 | 667 | 800 | 665 | 671 | 708 | 552 | 630 | 609 | 633 | 576 | 722 | 695 |
| 2020 | 590 | 616 | 558 | 660 | 654 | 547 | 550 | 557 | 675 | 496 | 512 | 507 |
| 2021 | 571 | 750 | 664 | 869 | 891 | 878 | 698 | 818 | 858 | 800 | 745 | 639 |
| 2022 | 492 | 597 | 422 | 564 | 423 | 508 | 482 | 519 | 509 | 393 | 511 | 466 |
| 2023 | 470 | 578 | 669 | 543 | 436 | 433 | 404 | 524 | 515 | 599 | 602 | 411 |
| 2024 | 429 | |||||||||||
| - = No Data Reported; -- = Not Applicable; NA = Not Available; W = Withheld to avoid disclosure of individual company data. |
| Release Date: 3/29/2024 |
| Next Release Date: 4/30/2024 |