|
Download Data (XLS File) |
|
||||||||
|
||||||||
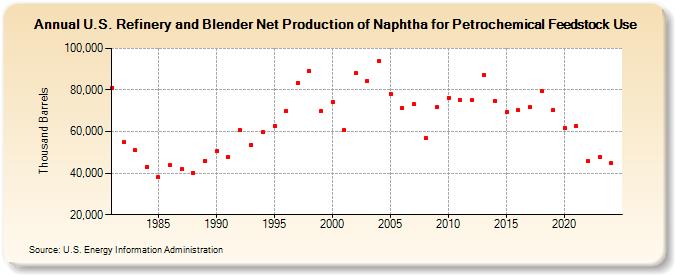
| U.S. Refinery and Blender Net Production of Naphtha for Petrochemical Feedstock Use (Thousand Barrels) | ||||||||
| Decade | Year-0 | Year-1 | Year-2 | Year-3 | Year-4 | Year-5 | Year-6 | Year-7 | Year-8 | Year-9 |
|---|---|---|---|---|---|---|---|---|---|---|
| 1980's | 81,026 | 54,816 | 51,028 | 42,942 | 38,007 | 43,778 | 41,911 | 40,225 | 45,924 | |
| 1990's | 50,498 | 47,852 | 60,659 | 53,689 | 59,589 | 62,770 | 70,060 | 83,560 | 89,176 | 69,718 |
| 2000's | 74,039 | 60,729 | 88,003 | 84,395 | 93,796 | 78,286 | 71,548 | 73,034 | 56,999 | 71,603 |
| 2010's | 76,367 | 75,347 | 75,054 | 87,357 | 74,553 | 69,375 | 70,159 | 71,578 | 79,292 | 70,277 |
| 2020's | 61,912 | 62,548 | 45,932 | 47,781 |
| - = No Data Reported; -- = Not Applicable; NA = Not Available; W = Withheld to avoid disclosure of individual company data. |
| Release Date: 8/30/2024 |
| Next Release Date: 8/29/2025 |