|
Download Data (XLS File) |
|
||||||||
|
||||||||
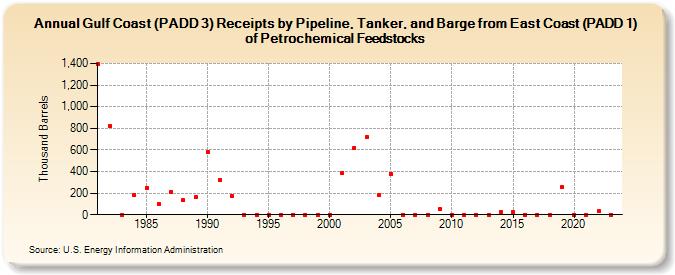
| Gulf Coast (PADD 3) Receipts by Pipeline, Tanker, and Barge from East Coast (PADD 1) of Petrochemical Feedstocks (Thousand Barrels) | ||||||||
| Decade | Year-0 | Year-1 | Year-2 | Year-3 | Year-4 | Year-5 | Year-6 | Year-7 | Year-8 | Year-9 |
|---|---|---|---|---|---|---|---|---|---|---|
| 1980's | 1,396 | 823 | 0 | 182 | 250 | 98 | 212 | 133 | 164 | |
| 1990's | 577 | 324 | 173 | 0 | 0 | 0 | 0 | 0 | 0 | 0 |
| 2000's | 0 | 383 | 616 | 719 | 185 | 380 | 0 | 0 | 0 | 49 |
| 2010's | 0 | 0 | 0 | 0 | 25 | 25 | 0 | 0 | 0 | 255 |
| 2020's | 0 | 0 | 31 | 0 |
| - = No Data Reported; -- = Not Applicable; NA = Not Available; W = Withheld to avoid disclosure of individual company data. |
| Release Date: 3/29/2024 |
| Next Release Date: 8/30/2024 |