|
Download Data (XLS File) |
|
||||||||
|
||||||||
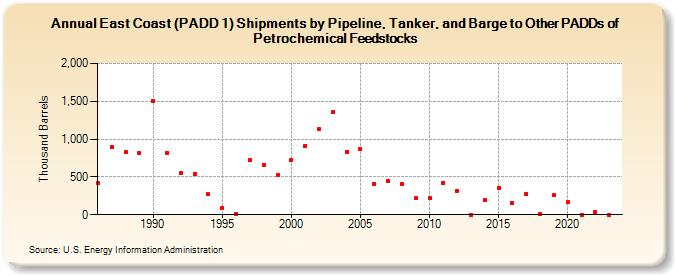
| East Coast (PADD 1) Shipments by Pipeline, Tanker, and Barge to Other PADDs of Petrochemical Feedstocks (Thousand Barrels) | ||||||||
| Decade | Year-0 | Year-1 | Year-2 | Year-3 | Year-4 | Year-5 | Year-6 | Year-7 | Year-8 | Year-9 |
|---|---|---|---|---|---|---|---|---|---|---|
| 1980's | 415 | 895 | 827 | 815 | ||||||
| 1990's | 1,504 | 821 | 552 | 538 | 268 | 83 | 12 | 724 | 654 | 528 |
| 2000's | 726 | 910 | 1,132 | 1,352 | 831 | 869 | 411 | 452 | 407 | 218 |
| 2010's | 218 | 424 | 319 | 0 | 189 | 356 | 151 | 280 | 9 | 255 |
| 2020's | 162 | 0 | 31 | 0 |
| - = No Data Reported; -- = Not Applicable; NA = Not Available; W = Withheld to avoid disclosure of individual company data. |
| Release Date: 3/29/2024 |
| Next Release Date: 8/30/2024 |
Referring Pages: