|
Download Data (XLS File) |
|
||||||||
|
||||||||
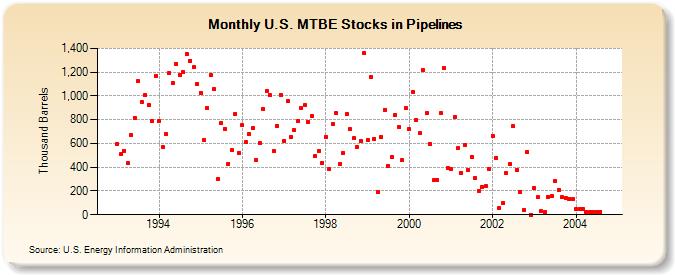
| U.S. MTBE Stocks in Pipelines (Thousand Barrels) | ||||||||
| Year | Jan | Feb | Mar | Apr | May | Jun | Jul | Aug | Sep | Oct | Nov | Dec |
|---|---|---|---|---|---|---|---|---|---|---|---|---|
| 1993 | 595 | 507 | 539 | 432 | 675 | 818 | 1,124 | 952 | 1,009 | 926 | 786 | 1,164 |
| 1994 | 793 | 571 | 679 | 1,197 | 1,111 | 1,270 | 1,177 | 1,203 | 1,349 | 1,296 | 1,242 | 1,099 |
| 1995 | 1,028 | 625 | 898 | 1,176 | 1,056 | 302 | 771 | 725 | 429 | 542 | 849 | 523 |
| 1996 | 752 | 608 | 680 | 728 | 459 | 600 | 887 | 1,043 | 1,004 | 535 | 745 | 1,010 |
| 1997 | 624 | 957 | 655 | 713 | 787 | 897 | 923 | 780 | 830 | 493 | 540 | 436 |
| 1998 | 655 | 382 | 763 | 852 | 426 | 520 | 844 | 718 | 643 | 573 | 622 | 1,361 |
| 1999 | 630 | 1,163 | 640 | 195 | 653 | 884 | 409 | 484 | 841 | 742 | 458 | 896 |
| 2000 | 719 | 1,033 | 799 | 684 | 1,216 | 853 | 598 | 289 | 295 | 855 | 1,231 | 392 |
| 2001 | 383 | 823 | 561 | 355 | 584 | 377 | 490 | 307 | 202 | 235 | 238 | 382 |
| 2002 | 666 | 481 | 57 | 100 | 349 | 430 | 744 | 376 | 189 | 43 | 528 | 1 |
| 2003 | 225 | 146 | 29 | 21 | 148 | 156 | 283 | 212 | 149 | 139 | 133 | 131 |
| 2004 | 48 | 48 | 48 | 25 | 25 | 25 | 25 | 25 | ||||
| - = No Data Reported; -- = Not Applicable; NA = Not Available; W = Withheld to avoid disclosure of individual company data. |
| Release Date: 3/29/2024 |
| Next Release Date: 4/30/2024 |
Referring Pages: