|
Download Data (XLS File) |
|
||||||||
|
||||||||
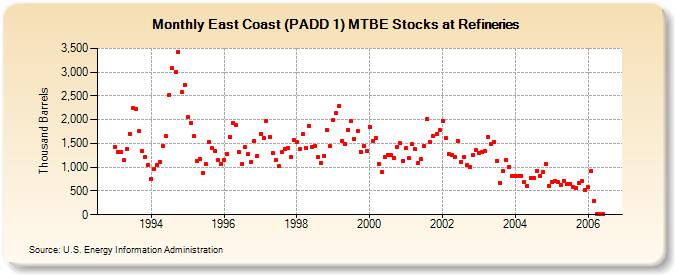
| East Coast (PADD 1) MTBE Stocks at Refineries (Thousand Barrels) | ||||||||
| Year | Jan | Feb | Mar | Apr | May | Jun | Jul | Aug | Sep | Oct | Nov | Dec |
|---|---|---|---|---|---|---|---|---|---|---|---|---|
| 1993 | 1,433 | 1,330 | 1,325 | 1,151 | 1,380 | 1,705 | 2,239 | 2,233 | 1,754 | 1,342 | 1,215 | 1,053 |
| 1994 | 754 | 971 | 1,055 | 1,115 | 1,438 | 1,656 | 2,513 | 3,089 | 3,008 | 3,431 | 2,576 | 2,737 |
| 1995 | 2,058 | 1,937 | 1,655 | 1,140 | 1,182 | 884 | 1,077 | 1,540 | 1,407 | 1,351 | 1,142 | 1,072 |
| 1996 | 1,157 | 1,282 | 1,635 | 1,929 | 1,884 | 1,327 | 1,072 | 1,430 | 1,268 | 1,112 | 1,551 | 1,240 |
| 1997 | 1,706 | 1,624 | 1,962 | 1,644 | 1,301 | 1,148 | 1,017 | 1,313 | 1,391 | 1,410 | 1,209 | 1,574 |
| 1998 | 1,529 | 1,383 | 1,692 | 1,411 | 1,876 | 1,420 | 1,444 | 1,205 | 1,088 | 1,246 | 1,780 | 1,437 |
| 1999 | 1,992 | 2,132 | 2,293 | 1,546 | 1,480 | 1,791 | 1,964 | 1,596 | 1,765 | 1,330 | 1,446 | 1,349 |
| 2000 | 1,855 | 1,551 | 1,616 | 1,072 | 895 | 1,216 | 1,259 | 1,267 | 1,196 | 1,433 | 1,502 | 1,138 |
| 2001 | 1,403 | 1,184 | 1,479 | 1,377 | 1,098 | 1,163 | 1,447 | 2,009 | 1,524 | 1,652 | 1,705 | 1,779 |
| 2002 | 1,975 | 1,616 | 1,275 | 1,249 | 1,212 | 1,561 | 1,114 | 1,212 | 1,045 | 1,012 | 1,254 | 1,360 |
| 2003 | 1,298 | 1,311 | 1,350 | 1,637 | 1,486 | 1,534 | 1,140 | 675 | 913 | 1,158 | 1,007 | 825 |
| 2004 | 810 | 817 | 823 | 690 | 607 | 780 | 769 | 920 | 810 | 899 | 1,077 | 604 |
| 2005 | 689 | 708 | 678 | 625 | 707 | 653 | 652 | 593 | 553 | 677 | 711 | 512 |
| 2006 | 576 | 910 | 284 | 14 | 25 | 7 | ||||||
| - = No Data Reported; -- = Not Applicable; NA = Not Available; W = Withheld to avoid disclosure of individual company data. |
| Release Date: 3/29/2024 |
| Next Release Date: 4/30/2024 |