|
Download Data (XLS File) |
|
||||||||
|
||||||||
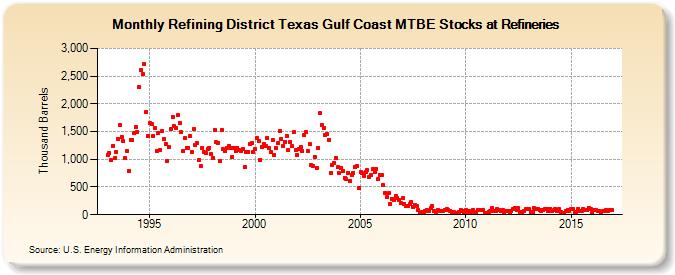
| Refining District Texas Gulf Coast MTBE Stocks at Refineries (Thousand Barrels) | ||||||||
| Year | Jan | Feb | Mar | Apr | May | Jun | Jul | Aug | Sep | Oct | Nov | Dec |
|---|---|---|---|---|---|---|---|---|---|---|---|---|
| 1993 | 1,084 | 1,112 | 984 | 1,242 | 1,021 | 1,127 | 1,371 | 1,613 | 1,405 | 1,325 | 1,025 | 1,156 |
| 1994 | 785 | 1,349 | 1,355 | 1,465 | 1,576 | 1,494 | 2,295 | 2,609 | 2,536 | 2,714 | 1,852 | 1,413 |
| 1995 | 1,651 | 1,633 | 1,427 | 1,573 | 1,151 | 1,478 | 1,163 | 1,503 | 1,369 | 1,280 | 975 | 1,225 |
| 1996 | 1,549 | 1,765 | 1,598 | 1,559 | 1,791 | 1,657 | 1,485 | 1,156 | 1,381 | 1,210 | 1,209 | 1,427 |
| 1997 | 1,135 | 1,548 | 1,257 | 1,289 | 980 | 878 | 1,209 | 1,131 | 1,109 | 1,183 | 1,210 | 1,093 |
| 1998 | 1,029 | 1,533 | 1,304 | 1,300 | 964 | 1,536 | 1,178 | 1,145 | 1,202 | 1,247 | 1,210 | 1,048 |
| 1999 | 1,205 | 1,144 | 1,204 | 1,161 | 1,158 | 1,184 | 855 | 1,129 | 1,132 | 1,272 | 1,290 | 1,138 |
| 2000 | 1,183 | 1,378 | 1,333 | 993 | 1,230 | 1,281 | 1,237 | 1,389 | 1,207 | 1,132 | 1,347 | 1,085 |
| 2001 | 1,201 | 1,298 | 1,510 | 1,361 | 1,236 | 1,319 | 1,428 | 1,159 | 1,318 | 1,234 | 1,484 | 1,172 |
| 2002 | 1,071 | 1,181 | 1,224 | 1,148 | 1,444 | 1,495 | 1,141 | 1,275 | 899 | 883 | 1,042 | 842 |
| 2003 | 1,206 | 1,826 | 1,622 | 1,567 | 1,445 | 1,457 | 1,356 | 753 | 899 | 941 | 1,030 | 854 |
| 2004 | 751 | 843 | 780 | 669 | 639 | 761 | 612 | 720 | 754 | 869 | 870 | 475 |
| 2005 | 762 | 744 | 705 | 769 | 803 | 677 | 714 | 822 | 767 | 825 | 642 | 710 |
| 2006 | 719 | 535 | 395 | 322 | 387 | 199 | 292 | 259 | 339 | 304 | 273 | 204 |
| 2007 | 301 | 201 | 160 | 164 | 187 | 228 | 146 | 180 | 165 | 85 | 36 | 46 |
| 2008 | 55 | 74 | 85 | 74 | 120 | 151 | 58 | 48 | 84 | 69 | 61 | 67 |
| 2009 | 88 | 107 | 87 | 67 | 47 | 54 | 25 | 31 | 52 | 90 | 76 | 47 |
| 2010 | 81 | 53 | 60 | 56 | 89 | 51 | 38 | 79 | 92 | 79 | 24 | |
| 2011 | 28 | 56 | 67 | 114 | 67 | 65 | 103 | 86 | 67 | 89 | 53 | 58 |
| 2012 | 61 | 27 | 72 | 110 | 116 | 87 | 114 | 50 | 52 | 61 | 95 | 112 |
| 2013 | 96 | 54 | 44 | 116 | 99 | 100 | 82 | 71 | 78 | 107 | 111 | 65 |
| 2014 | 108 | 68 | 79 | 112 | 65 | 98 | 52 | 24 | 25 | 68 | 84 | 76 |
| 2015 | 101 | 96 | 33 | 52 | 107 | 65 | 72 | 100 | 87 | 92 | 130 | 104 |
| 2016 | 32 | 83 | 77 | 73 | 67 | 53 | 62 | 63 | 94 | 59 | 88 | 81 |
| 2017 | 93 | 63 | 51 | 70 | ||||||||
| - = No Data Reported; -- = Not Applicable; NA = Not Available; W = Withheld to avoid disclosure of individual company data. |
| Release Date: 3/29/2024 |
| Next Release Date: 4/30/2024 |