|
Download Data (XLS File) |
|
||||||||
|
||||||||
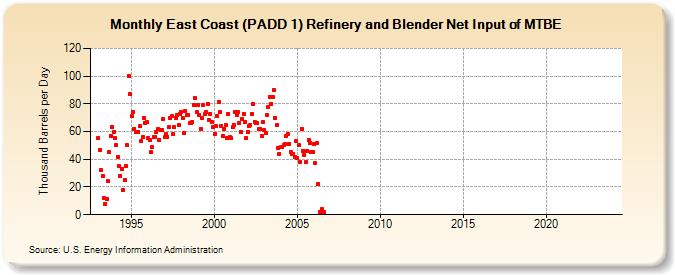
| East Coast (PADD 1) Refinery and Blender Net Input of MTBE (Thousand Barrels per Day) | ||||||||
| Year | Jan | Feb | Mar | Apr | May | Jun | Jul | Aug | Sep | Oct | Nov | Dec |
|---|---|---|---|---|---|---|---|---|---|---|---|---|
| 1993 | 55 | 47 | 32 | 28 | 12 | 8 | 11 | 24 | 45 | 57 | 63 | 60 |
| 1994 | 55 | 50 | 42 | 35 | 28 | 33 | 18 | 25 | 35 | 50 | 100 | 87 |
| 1995 | 71 | 74 | 62 | 60 | 60 | 60 | 64 | 53 | 56 | 70 | 66 | 67 |
| 1996 | 55 | 54 | 45 | 49 | 56 | 56 | 60 | 62 | 54 | 61 | 61 | 69 |
| 1997 | 56 | 58 | 56 | 63 | 70 | 71 | 58 | 63 | 70 | 72 | 65 | 73 |
| 1998 | 74 | 70 | 59 | 75 | 72 | 72 | 66 | 66 | 67 | 79 | 84 | 74 |
| 1999 | 79 | 72 | 62 | 70 | 79 | 73 | 74 | 80 | 68 | 73 | 67 | 63 |
| 2000 | 58 | 64 | 71 | 81 | 74 | 64 | 57 | 62 | 65 | 55 | 73 | 56 |
| 2001 | 55 | 63 | 65 | 74 | 72 | 74 | 66 | 60 | 69 | 73 | 67 | 55 |
| 2002 | 60 | 64 | 65 | 73 | 80 | 67 | 66 | 66 | 62 | 62 | 57 | 67 |
| 2003 | 61 | 59 | 72 | 78 | 85 | 80 | 85 | 90 | 70 | 65 | 48 | 44 |
| 2004 | 49 | 49 | 50 | 51 | 57 | 58 | 51 | 45 | 44 | 44 | 42 | 53 |
| 2005 | 41 | 50 | 38 | 62 | 46 | 43 | 38 | 46 | 54 | 52 | 45 | 45 |
| 2006 | 51 | 37 | 52 | 22 | 2 | 1 | 4 | 2 | ||||
| 2019 | -- | -- | -- | -- | -- | -- | -- | -- | -- | -- | -- | -- |
| 2020 | -- | -- | -- | -- | -- | -- | -- | -- | -- | -- | -- | -- |
| 2021 | -- | -- | -- | -- | -- | -- | -- | -- | -- | -- | -- | |
| 2022 | -- | -- | -- | -- | -- | -- | -- | -- | -- | -- | -- | -- |
| 2023 | -- | -- | -- | -- | -- | -- | -- | -- | -- | -- | -- | -- |
| 2024 | -- | |||||||||||
| - = No Data Reported; -- = Not Applicable; NA = Not Available; W = Withheld to avoid disclosure of individual company data. |
| Release Date: 3/29/2024 |
| Next Release Date: 4/30/2024 |